Plotting TCanvas using if, for and while

Hello, I wrote this macro
calotb21.cpp (2.3 KB)
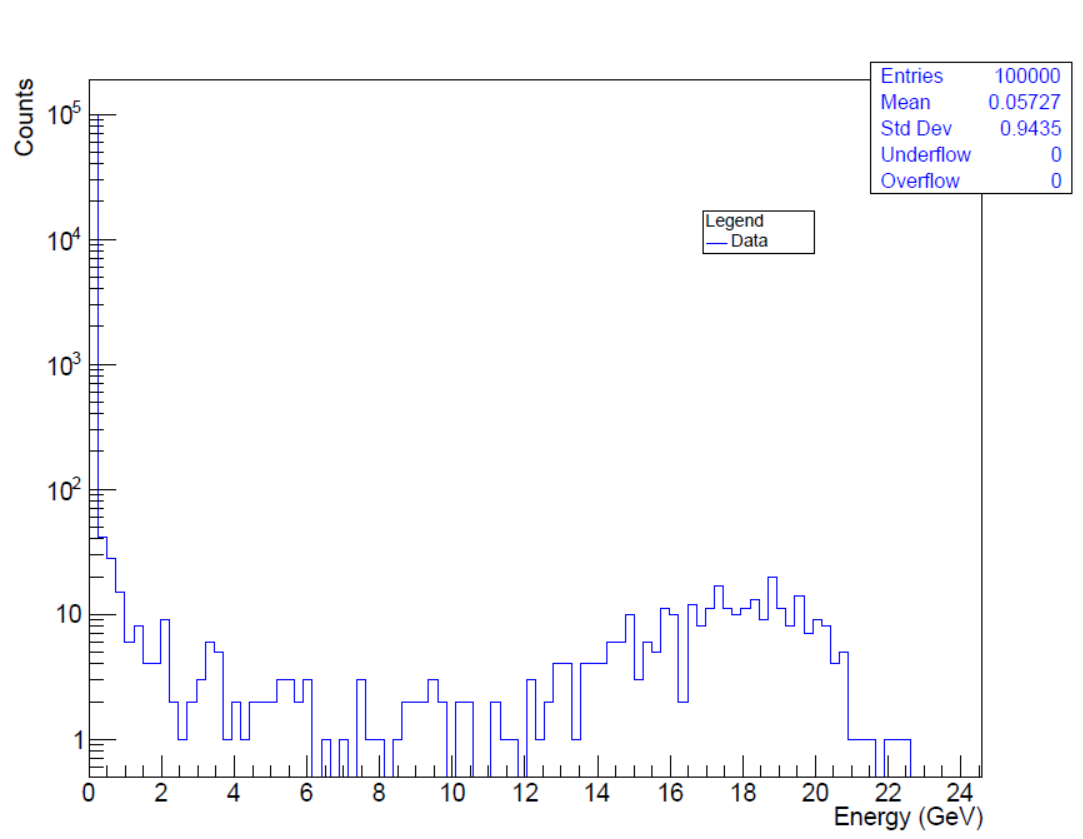
with whom I’m able to plot deposited energy by all particles in each of my simulated Geant4 detectors (named 0,1,2…23).

For example here the deposited energy in detector 0

Now I’ve

  1. To distinguish the deposited energy by each particle typology i.e. I’ve to plot Calo_EnDep[n] for positrons, for electrons, for muons etc.
    then I wrote a vector writing the PDG names of particle (positron==-11, electron==11, etc) in this way
int Idpart[10];
Idpart[0]= {-11,11,-13,13,22}

and I tried to use a while to read the values of Idpart[0]

while (Idpart[0]){

then my macro is now

calotb21.cpp (2.8 KB)

but I get this error

root [1] .x calotb21.cpp
In file included from input_line_65:1:
/TestBeam21/2021/03-03-05/LEMMA-TB2021/calotb21.cpp:37:17: error: excess elements in scalar initializer
                Idpart[0]= {-11,11,-13,13,22}
  1. Lastly (if possible) I would add an if for the
    c01->Print(outputname);

to save plots only if I’ve deposited energy i.e., if I don’t have deposited energy by particles x into the detector y, I don’t want to save the graph. Then, the macro should read the Calo_EnDep[x] using the
TString selection = TString::Format("Idp==%d", Idpart[0]);
and if this particle doesn’t deposit energy in the detector x, it doesn’t have to save the graph
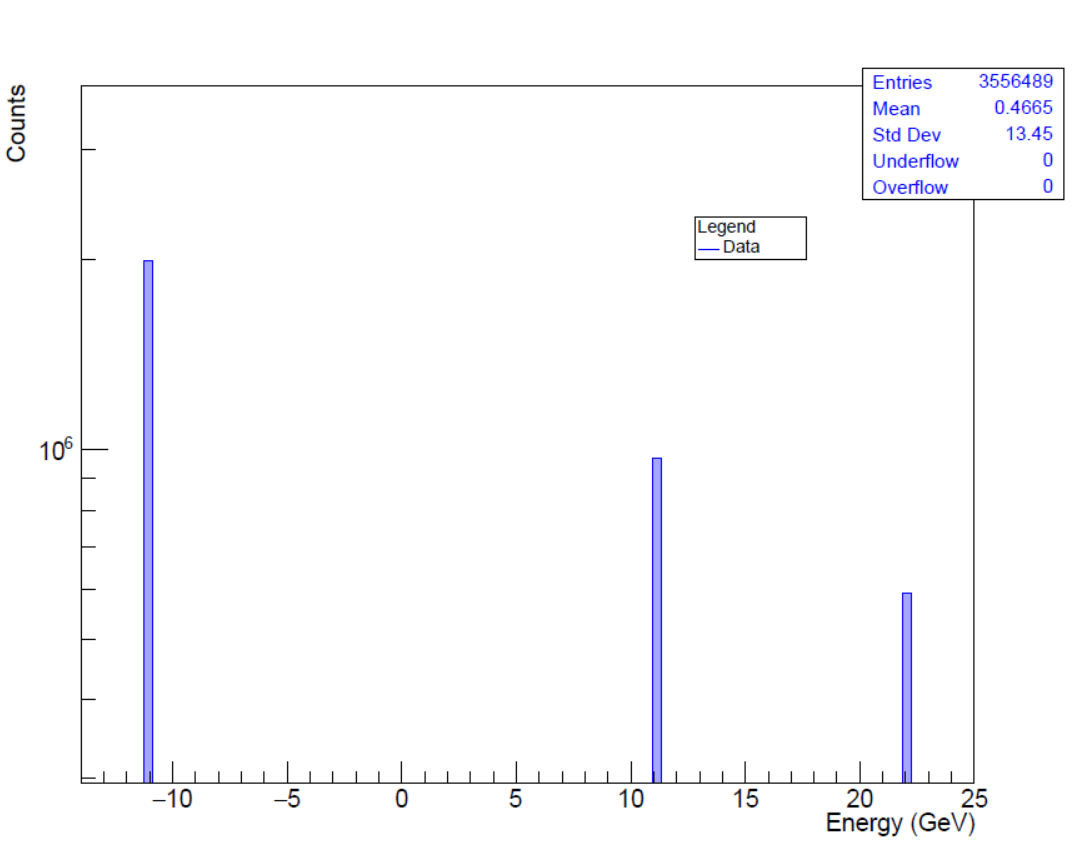
Here the root file

Notice that I’m uploading a root file created by simulating just 1000 events (to have just few MB)…then the deposited energy stored in this file is different by the one showed in the graph (obtained by simulating 10^5 events)


Please read tips for efficient and successful posting and posting code

ROOT Version: Not Provided
Platform: Not Provided
Compiler: Not Provided


Idpart[5]= {-11,11,-13,13,22}

Hello @couet thank you but I still get error


root [4] .x calotb21.cpp
In file included from input_line_73:1:
TestBeam21/2021/03-03-05/LEMMA-TB2021/calotb21.cpp:37:17: error: excess elements in scalar initializer
                Idpart[5]= {-11,11,-13,13,22};

calotb21.cpp (2.8 KB)

      while (Idpart[5]){

? what does that mean ?

Hello @couet I mean that I want plots for all the Idpart[5] values. I.e.
I need the plots of Calo_EnDep[0], Calo_EnDep[1] etc for Idpart=-11, Idpart=11 etc
it means I’ve 24 detectors and 5 particles, I neet 24*5= 125 different plots

Then

  1. the macro must start for particle Idpart -11 and produce all the Calo_EnDep[0], Calo_EnDep[1] etc
    2 the macro must switch to particle Idpart 11 and produce all the Calo_EnDep[0], Calo_EnDep[1] etc
    3.the macro must switch to particle Idpart -13 and produce all the Calo_EnDep[0], Calo_EnDep[1] etc
  2. the macro must switch to particle Idpart 13 and produce all the Calo_EnDep[0], Calo_EnDep[1] etc
  3. the macro must switch to particle Idpart 22 and produce all the Calo_EnDep[0], Calo_EnDep[1] etc

Laslty, if possible, I would save (in pdf) only graphs that have a no zero energy

void calotb21()
{
   gStyle->SetOptStat(111110);
   gSystem->mkdir(TString::Format("simulazione"), kTRUE);
   TFile *fin = TFile::Open("LemmaMC.root");
   fin->ls ();
   if (fin == 0) {
      printf("Error: cannot open the file!\n");
   } else {
      int Idpart[5]= {-11,11,-13,13,22};
      for (int i=0; i<5; i++){
         for (int calorimetro=0; calorimetro <24; calorimetro++ ){
            TTree *t=0;
            fin->GetObject("LEMMA",t);
            t->SetScanField(0);
            TCanvas *c01 = new TCanvas("c01","",1280,1024);
            c01->SetLogy();
            t->SetLineColor(kBlue);
            TString outputname = TString::Format("simulazione/Calo_EnDep[%d]_Idp=%d.pdf", calorimetro,Idpart[i]);
            TString henestring = TString::Format("Calo_EnDep[%d] >> htemp(100., 0., 0.)", calorimetro);
            TString selection = TString::Format("Idp==%d", Idpart[i]);
            t->Draw(henestring, selection);
            gPad->Modified();
            gPad->Update(); // make sure it's really (re)drawn
            t->GetHistogram()->SetTitle("");
            TH1F *hene = (TH1F*)gPad->GetPrimitive("htemp");
            hene->GetXaxis()->SetTitle("Energy (GeV)");
            hene->GetYaxis()->SetTitle("Counts");
            hene->GetXaxis()->SetLabelFont(43);
            hene->GetXaxis()->SetLabelSize(30);
            hene->GetYaxis()->SetLabelFont(43);
            hene->GetYaxis()->SetLabelSize(30);
            hene->GetXaxis()->SetTitleFont(43);
            hene->GetXaxis()->SetTitleSize(30);
            hene->GetYaxis()->SetTitleFont(43);
            hene->GetYaxis()->SetTitleSize(30);
            hene->Draw();
            hene->SetName("Title");
            gPad->Modified();
            gPad->Update(); // make sure it's really (re)drawn
            TLegend* legenea = new TLegend(0.65, 0.7, .75, .75);
            legenea->SetHeader("Legend");
            legenea->SetNColumns(1);
            legenea->AddEntry(hene, "Data", "l");
            legenea->Draw();
            gPad->Update();
            TPaveStats *stats = (TPaveStats*)hene->GetListOfFunctions()->FindObject("stats");
            stats->SetTextColor(kBlue);
            stats->SetX1NDC(0.80); stats->SetX2NDC(0.98);
            stats->SetY1NDC(0.77); stats->SetY2NDC(0.92);
            gPad->Update();
            c01->Print(outputname);
            delete c01;
         }
      }
   }
}

Well, do the test … you should know which variable to test…

Thank you @couet

I got the mean and standard deviation values from the hystogram

mean=hene->GetMean();
            stddev=hene->GetRMS();

and I wrote

if (mean !=0 && stddev !=0){
			c01->Print(outputname);
			}

because if mean == 0 && stddev==0, it means I don’t have deposited energy…I don’t know…maybe there is a better way to do it?

Other question please.
Now I see de produced particles by plotting the branche called Idp
i.e. I make this plot

by this macro

idpartb21.cpp (2.6 KB)

then I’ve to read the number (ie. the particles) produced and I’ve to fill the vector
int Idpart[3]= {-11,11,22};

should be possible to automatically read the possible values in the calotb21.cpp ? I mean automatically fill Idpart[n]= {x,y,z, etc};
?

calotb21.cpp (3.1 KB)

Well, It is up to you to decide, that’s your data. Surely it is a way.

You will need to loop over the bins of the histogram and store the LowEdge for each none empty bin. I do not see how that can be “automatic” …

Thank you @couet

I see then I will plot the graph and I will write manually the particle id!

This topic was automatically closed 14 days after the last reply. New replies are no longer allowed.