Hi,
I have a root file containing 2 graphs (one is TGraph gr and another is TGraphAsymmErrors ge). When I try to plot gr with an error band, I have to plot ge first and then plot gr in the same canvas so that the points of gr will not be covered by the band of ge. I did in the way:
gROOT->SetStyle("Plain");
TFile * f = new TFile("test.root", "read");
TGraphAsymmErrors * ge = (TGraphAsymmErrors*)f->Get("ge");
ge->SetMarkerColor(2);
ge->SetMarkerStyle(20);
ge->SetFillColor(17);
ge->SetFillStyle(1001);
ge->Draw("ap4");
gr->SetMarkerColor(2);
gr->Draw("p");
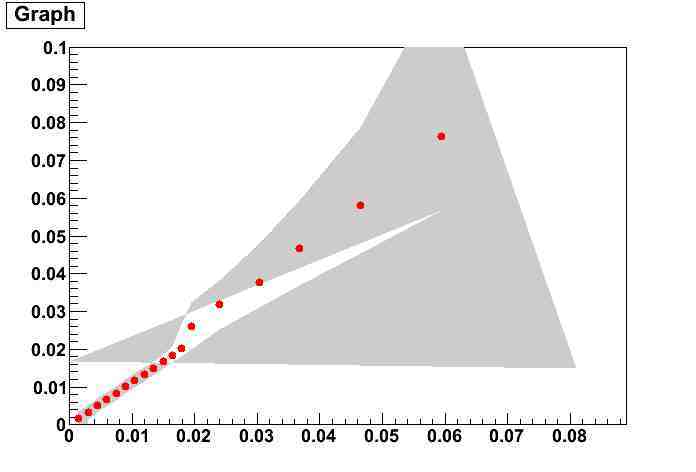
ge->SetMinimum(0);
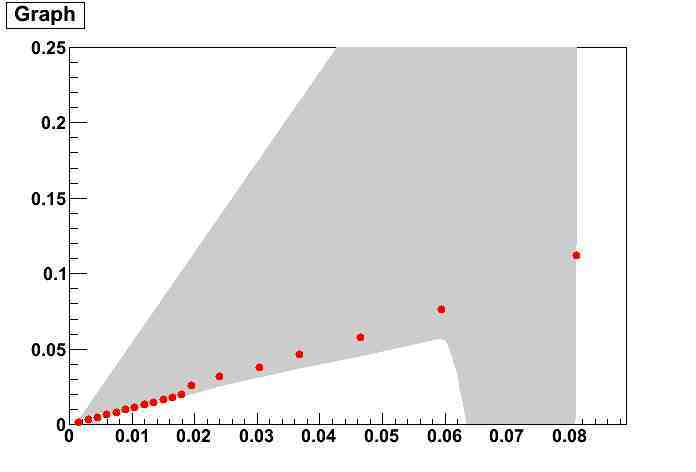
ge->SetMaximum(0.25);
c1->Modified();
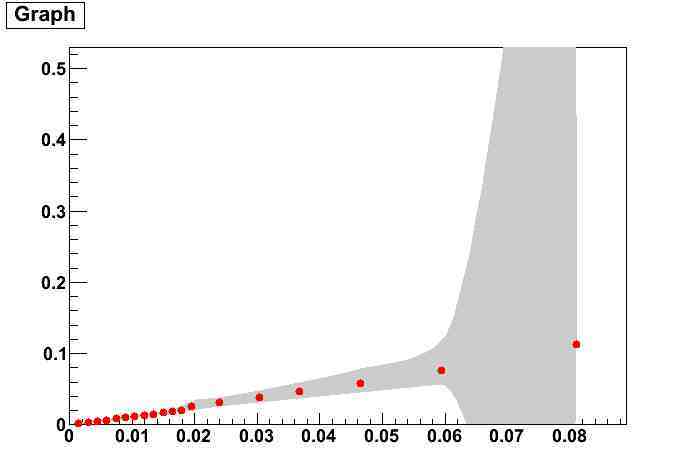
The graph plotted looks good if I don’t change the range of y-axis (ig. ge->SetMaximum(0.25) ). I posted 1 good and 1 bad graphs here. Apparently, after resetting the range of y-axis, the graph looks wrong. Please try my root file attached.
The option 4 should be used carefully. The smooth algorithm used is very simple and often does not give good results. See the explanation here: root.cern.ch/root/html/THistPainter.html#HP09
so even the plot you think is good is in fact wrong.
use option 3
Nope. The maximum value is 0.25 is fine either for me, but 0.1 is not fine, which seems that if I set a y-axis range that excludes some points the graph will be screwed up. The range 0.0 to 0.1 excludes the last point so the graph is not right, I tried 0.0 - 0.115, it is still good (because all points are in the range). In a summary, in order to plot correct error band, I have to make sure that the range covers all points.