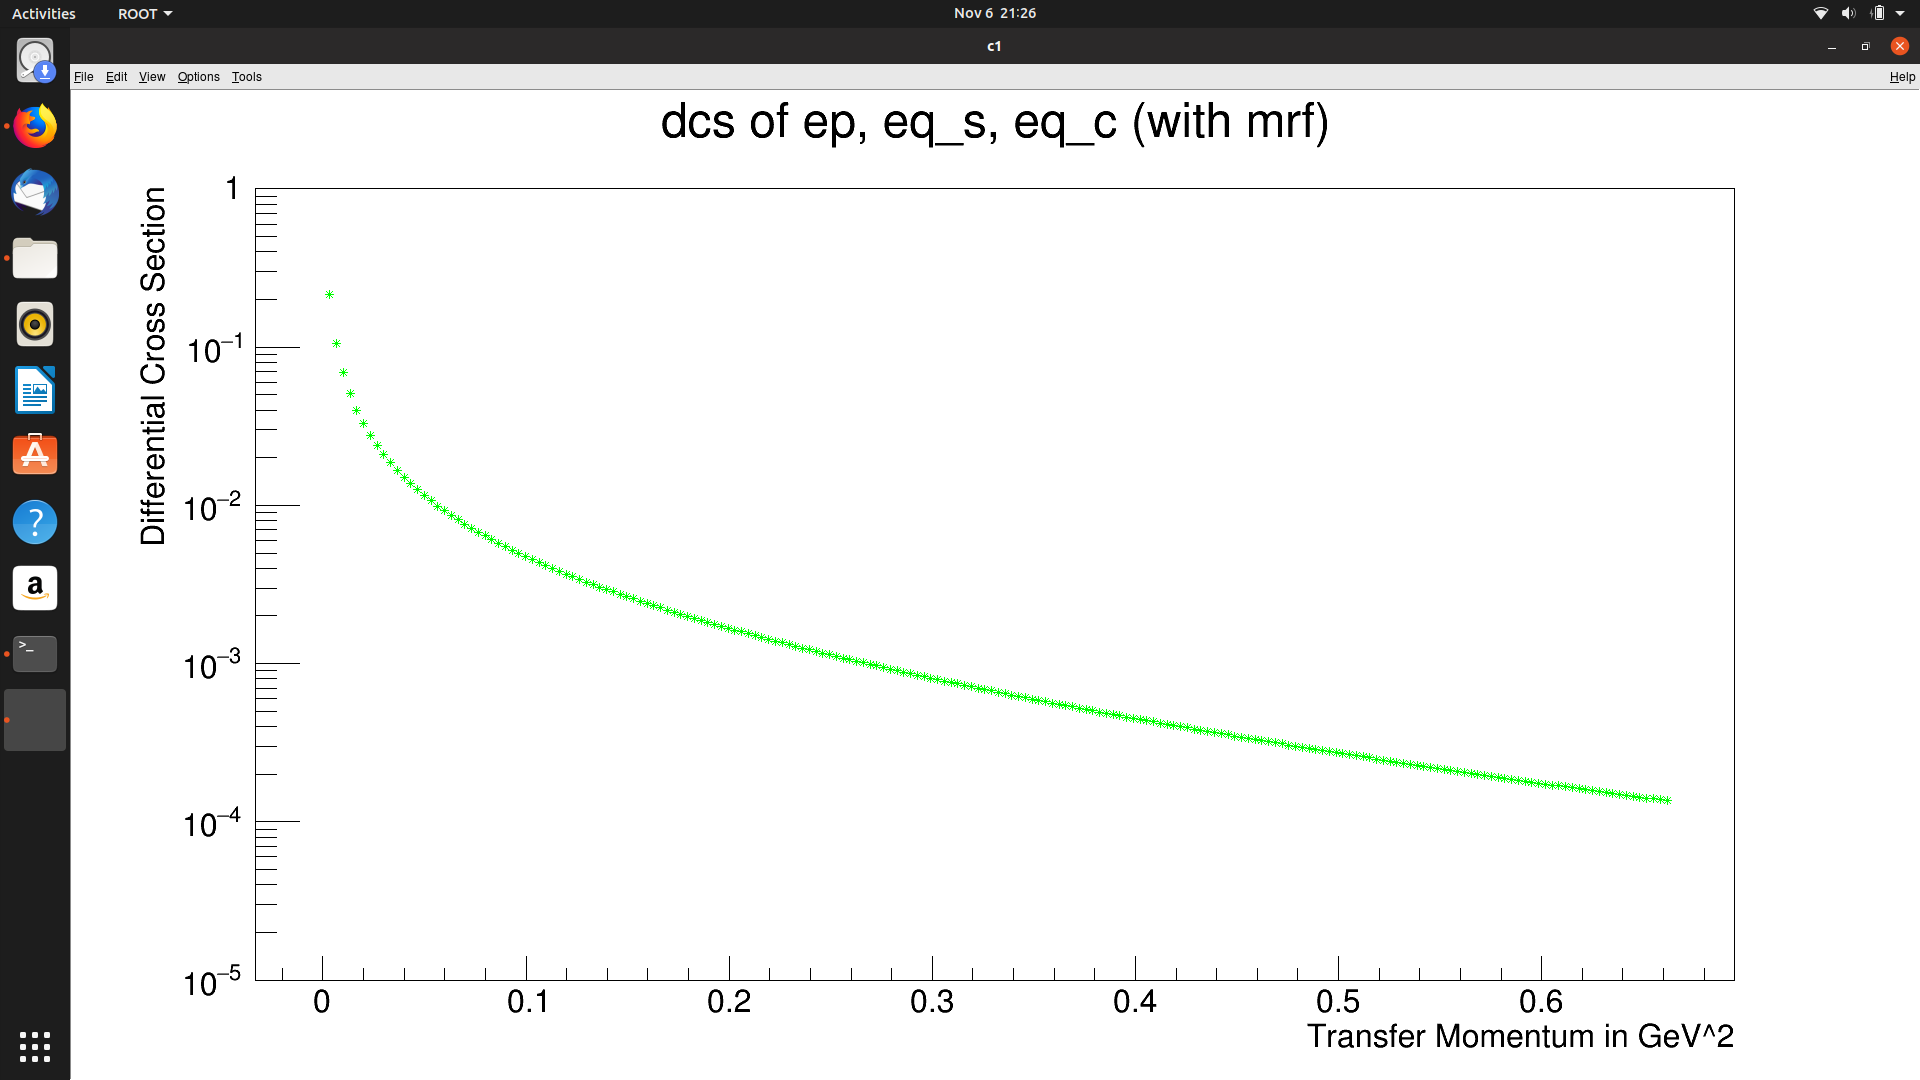
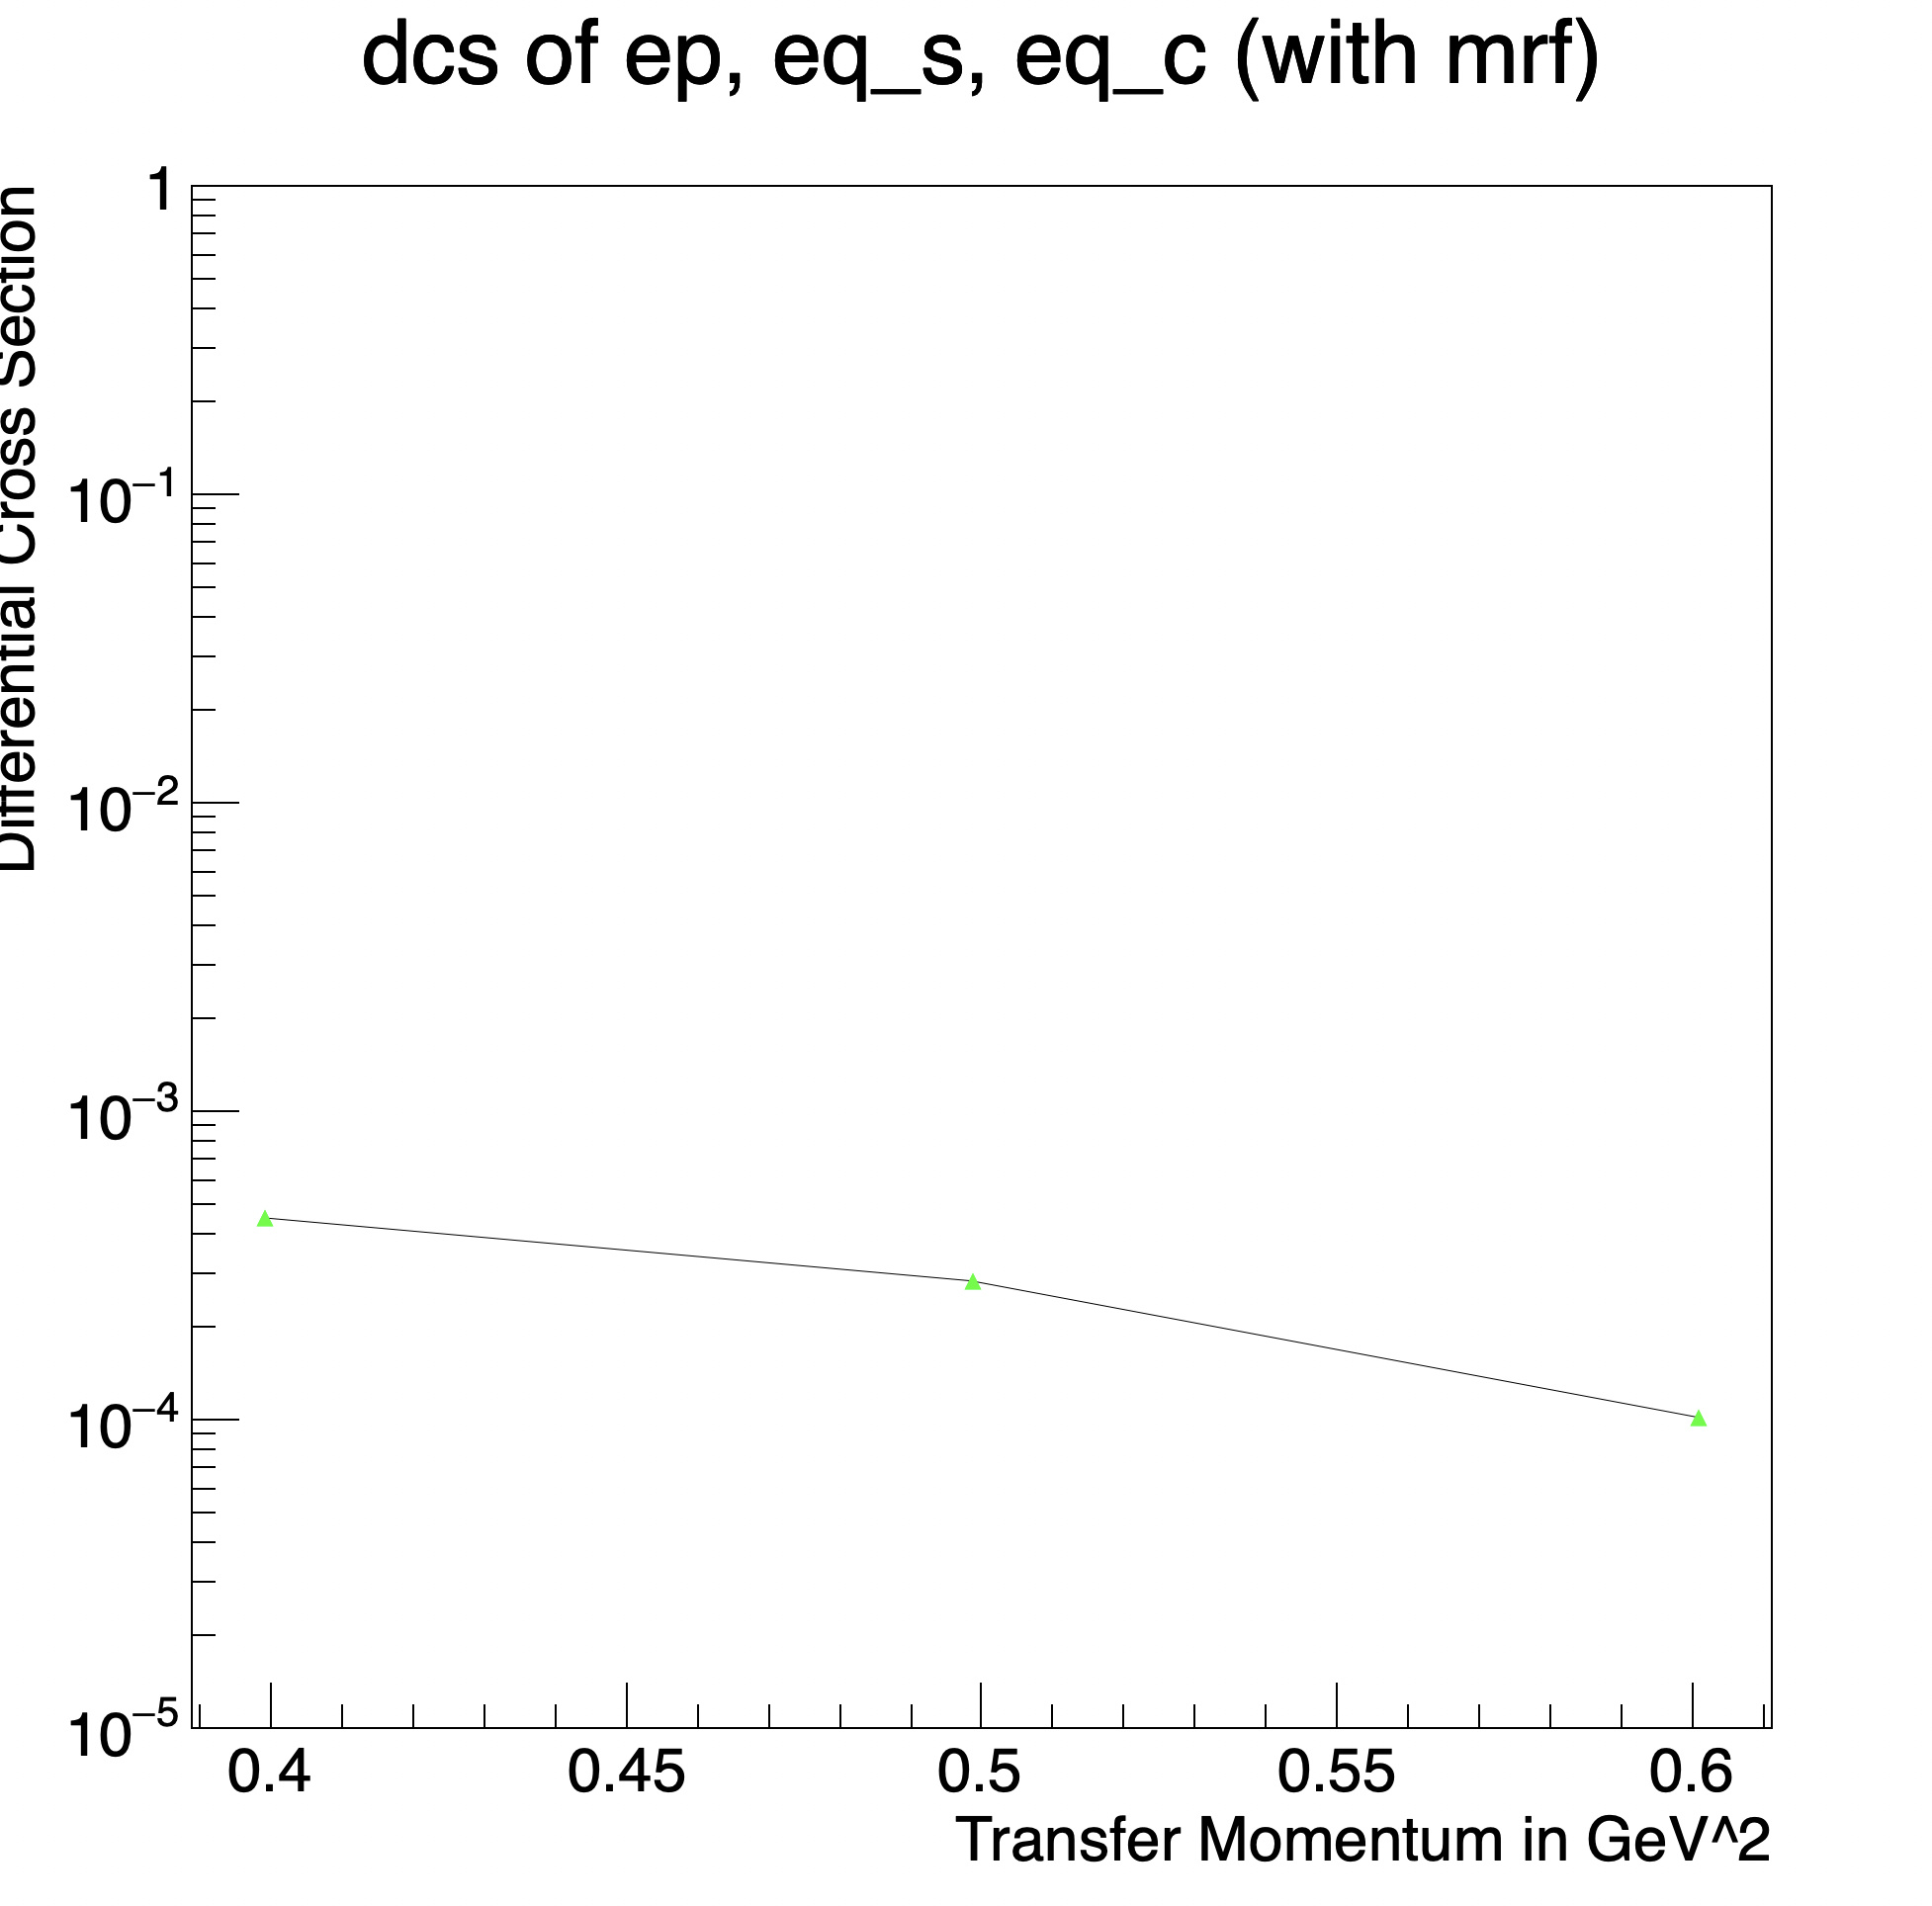
hi everyone  i would have wanted to print only just one point on a canvass.
kindly, see part of the code.
//=== generating the functions ===//
 for (Int_t i=0; i<nof; i++)
 {
  fna = "f"; fna += i;
  fpf[i] = new TF1("fna","(((2.0*[0]*[0]*[1]*[1]*[2]*[2]*[3]*[3])/(x*x*sin([4]*[5]/360.0)*sin([4]*[5]/360.0)*sin([4]*[5]/360.0)*sin([4]*[5]/360.0)+2.0*[3]*[3]*x*sin([4]*[5]/360.0)*sin([4]*[5]/360.0)+(x*sin([4]*[5]/360.0)*sin([4]*[5]/360.0)*sqrt(x*x*sin([4]*[5]/360.0)*sin([4]*[5]/360.0)*sin([4]*[5]/360.0)*sin([4]*[5]/360.0)+4.0*[3]*[3]*x*sin([4]*[5]/360.0)*sin([4]*[5]/360.0)))))*((2.0*[3]*[3])/(2.0*[3]*[3]+x*sin([4]*[5]/360.0)*sin([4]*[5]/360.0)+sqrt(x*x*sin([4]*[5]/360.0)*sin([4]*[5]/360.0)*sin([4]*[5]/360.0)*sin([4]*[5]/360.0)+4.0*[3]*[3]*x*sin([4]*[5]/360.0)*sin([4]*[5]/360.0))))*((4.0*[3]*[3])/(4.0*[3]*[3]+x))*(((0.71)/(0.71+x))*((0.71)/(0.71+x))*((0.71)/(0.71+x))*((0.71)/(0.71+x))*([7]*[7]*[8]*[8]*cos([4]*[5]/360.0)*cos([4]*[5]/360.0)+[6]*[6]*[7]*[7]*(2.0*[3]*[3]*x*cos([4]*[5]/360.0)*cos([4]*[5]/360.0)+4.0*[3]*[3]*x*sin([4]*[5]/360.0)*sin([4]*[5]/360.0)+x*x*sin([4]*[5]/360.0)*sin([4]*[5]/360.0))/(8.0*[3]*[3]*[3]*[3]))))", 0.0025, 1.0);
  fpf[i]->SetParameter(0,1.0);
  fpf[i]->SetParameter(1,1.0);
  fpf[i]->SetParameter(2,1.0/137.0);
  fpf[i]->SetParameter(3,gRandom->Gaus(0.938272081,0.000000006));
  fpf[i]->SetParameter(4,27.0);
  fpf[i]->SetParameter(5,TMath::Pi());
  fpf[i]->SetParameter(6,2.792847351);
  fpf[i]->SetParameter(7,gRandom->Gaus(0.979,0.022)+gRandom->Gaus(0.0,0.010));
  fpf[i]->SetParameter(8,gRandom->Gaus(0.914,0.024)+gRandom->Gaus(0.0,0.010));
 }

 Int_t nop=300;

 Double_t xpt, ypt, del = 0.9975/nop;

 auto av1 = new TGraph(nop);
 //TGraph *av1 = new TGraph();
 for (Int_t j=0; j < nop; j++)
 {
  xpt = del*j + 0.0025*del;
  av1->SetPoint(j, xpt, 0.0);
 }
 for (Int_t i=0; i<nof; i++)
 {
  for (Int_t j=0; j < nop; j++)
  {
   av1->GetPoint(j, xpt, ypt);
   av1->SetPoint(j, xpt, ypt + fpf[i]->Eval(xpt)/(Double_t)nof);
  }
 }

 av1->SetMarkerStyle(7);
 av1->SetMarkerColor(kGreen);
 av1->SetMarkerSize(1);

//=== Plotting the point on canvas ===//
int j = 0;

TGraph *av0000 = new TGraph();
double q20 = 0.399008;
double eps = 0.01;

 for (Int_t i=0; i<nof; i++)
 {
   av1->GetPoint(i, xpt, ypt);
   if ( abs(xpt - q20) < eps)
   {
    av0000->GetPoint(i, xpt, ypt);
    av0000->SetPoint(j, xpt, ypt + fpf[i]->Eval(xpt)/(Double_t)nof);
    j++;
   }
 }

 av0000->SetMarkerStyle(22);
 av0000->SetMarkerColor(3); //green
 av0000->SetMarkerSize(1);

TMultiGraph *mgp = new TMultiGraph();
 mgp->SetTitle("dcs of ep, eq_s, eq_c (with mrf); Transfer Momentum in GeV^2; Differential Cross Section");
 mgp->SetMinimum(1.e-5);
 mgp->SetMaximum(1.e0);
 mgp->Add(av0000,"*");
but I get a curve of points.