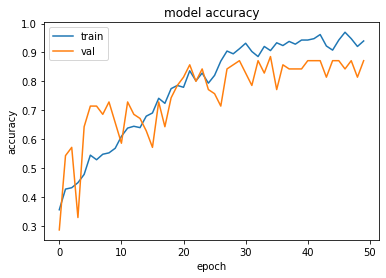
I am working on building a neural net with the PyKeras method of TMVA. I would love to be able to make a plot of the accuracy and loss over the course of all the epochs something like this:
But I can’t figure out how, if it’s even possible. Is there a way to call the accuracy and loss values of each epoch so I can plot them?
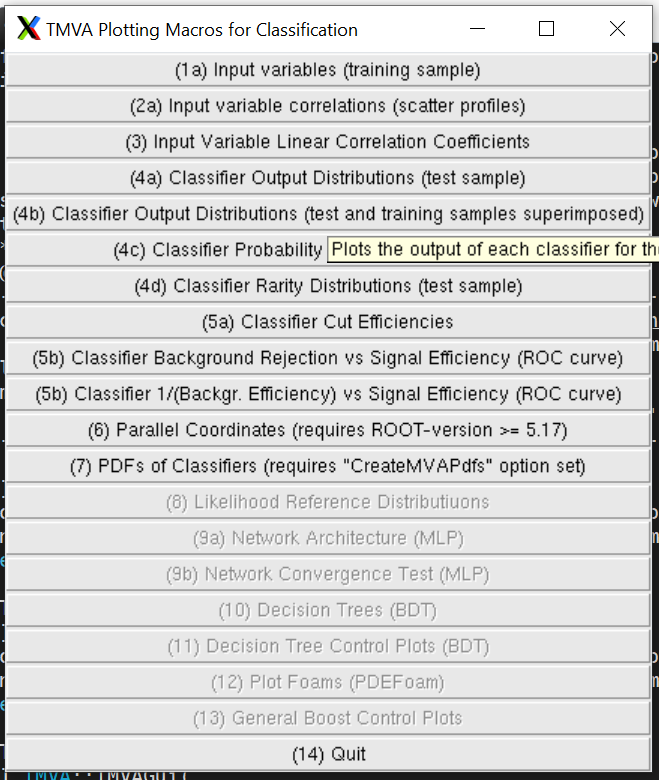
Unfortunately my GUI looks like this, with no TrainingHistory button. Is there some option I need to have enabled, or maybe an updated version of ROOT?
Yes , the TrainingHistory in the GUI has been introduced 2 years ago, from the ROOT version 6.20 and you are using 6.18, seeing from your first post.
If you can upgrade version, then you will have it