Hi,
I am trying to plot a histogram from a user defined discrete function. My function is
x and y are uniform distribution between (0,1) and w = x + y
f(w) = w for 0<=w<=1
= 2-w for 1<=w<=2
= 0 for otherwise
When I try to implement I don’t get any plot. I cannot figure out where my mistake is. I have attached my macros.ex5n.C (581 Bytes)
Thank you.
_
Please read tips for efficient and successful posting and posting code
ROOT Version: Not Provided
Platform: Not Provided
Compiler: Not Provided
couet
2
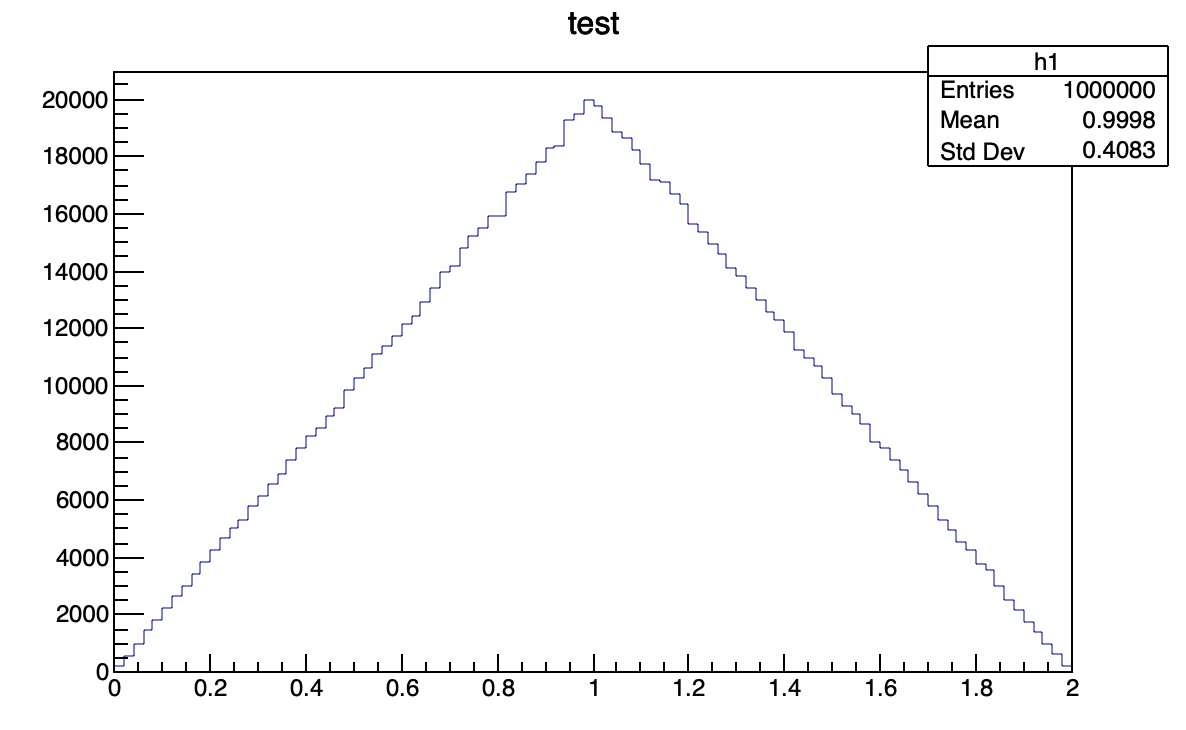
There was many mistakes in your code. Here is the corrected version:
double myfunction(double *x, double *par) {
   TRandom3 * generator = new TRandom3();
   double x1 = generator->Uniform(0,1);
   double y1 = generator->Uniform(0,1);
   double w1 = x1 + y1;
   if (w1>=0.&& w1<=1.){
      return w1;
   } else if (w1>1.&& w1<=2.) {
      return (2.-w1);
   } else {
      return 0.;
   };
}

void ex5n() {
   auto c1 = new TCanvas("canvas","Example",200,10,600,400);
   auto f1 = new TF1("f1",myfunction,0,2,0);
   auto h1 = new TH1F("h1", "test", 100, 0., 2.);
   h1->FillRandom("f1",1000000);
   h1->Draw();
}
Does it (h1->FillRandom(“f1”,1000000) command fill the random number inside the Histogram or fills the numbers defined by the function “myfunction”?
I want to fill the numbers according to myfunction. I don’t know if I am doing it correct.
couet
5
Yes in principle it will generate 1000000 random points according to your function … Is that what you want ? @moneta can tell you more.
Yes it will generate 1000000 random points according to your function and use them to fill the histogram!
Does it make sense to my code? Because I am generating the random numbers in myfunction. And than want to fill that w1 which is sum of x1 and y1?
But again I generate random numbers according to function? (h1->FillRandom(“f1”,1000000)
How can I fill the numbers generated by my function?
Thank you.
couet
8
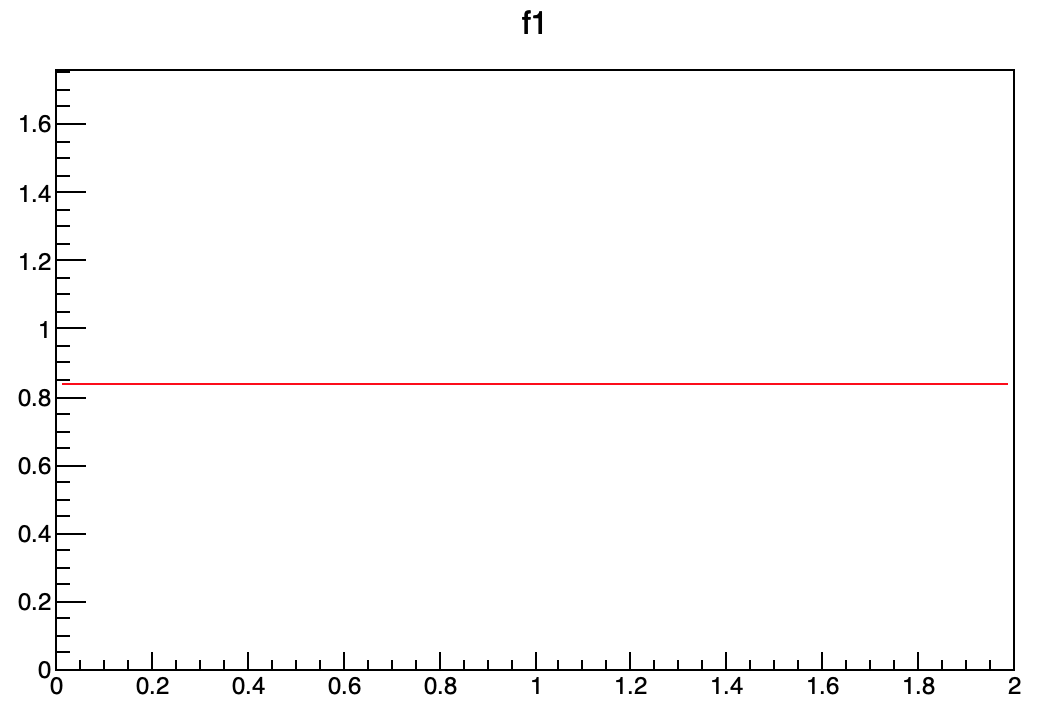
The best is to Draw your function and see if that’s what you want. if you Draw it you will get the following flat distribution:
Is it what you are looking for ?
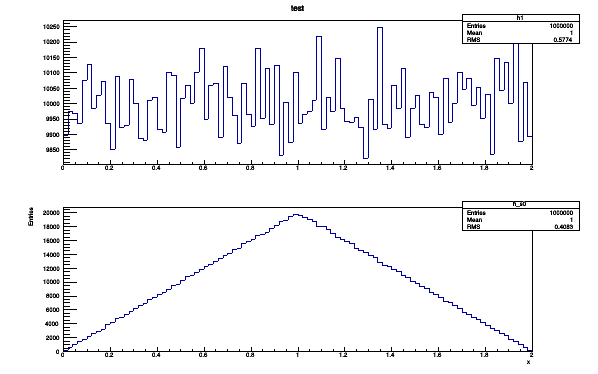
I expect the graph shown in 2nd row (b). Does (h1->FillN(“f1”,1000000); ) will work? I don’t know how to implement it.
couet
10
The definition of your function is not correct i guess.
The function is
I am trying to plot a histogram from a user defined discrete function. My function is
x and y are uniform distribution between (0,1) and w = x + y
f(w) = w for 0<=w<=1
= 2-w for 1<=w<=2
= 0 for otherwise
My confusion is if i implement the code using h1->FillRandom(“f1”,10000); I am doing it twice.
couet
12
// f(w) = w for 0<=w<=1
// = 2-w for 1<=w<=2
// = 0 for otherwise

double myfunction(double *w, double *par) {
   if (w[0] >= 0. && w[0] <= 1.){
      return w[0];
   } else if (w[0]>1. &&  w[0]<=2.) {
      return (2.-w[0]);
   } else {
      return 0.;
   };
}

void ex5n() {
   auto c1 = new TCanvas("canvas","Example",200,10,600,400);
   auto f1 = new TF1("f1",myfunction,0,2,0);
   auto h1 = new TH1F("h1", "test", 100, 0., 2.);
   h1->FillRandom("f1",1000000);
   h1->Draw();
}