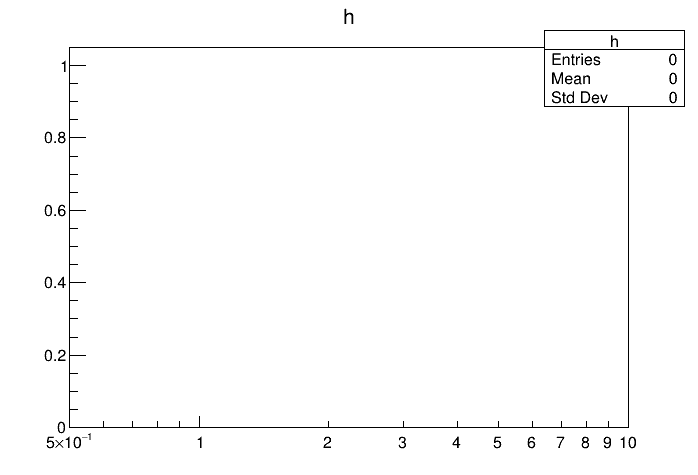
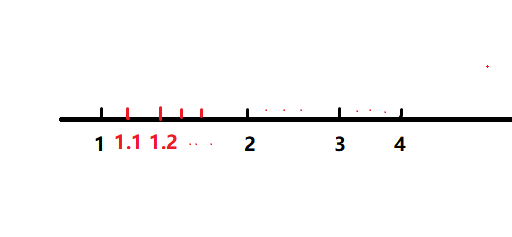
I am writing to see if there is a way to plot axis ticks with a precision of 0.1 when that axis is set to log scale? For example, in a range from 0.5 to 10, plotting ticks at 0.6, 0.7,…, 1.1, 1.2, …, 2.1,2.2,…?
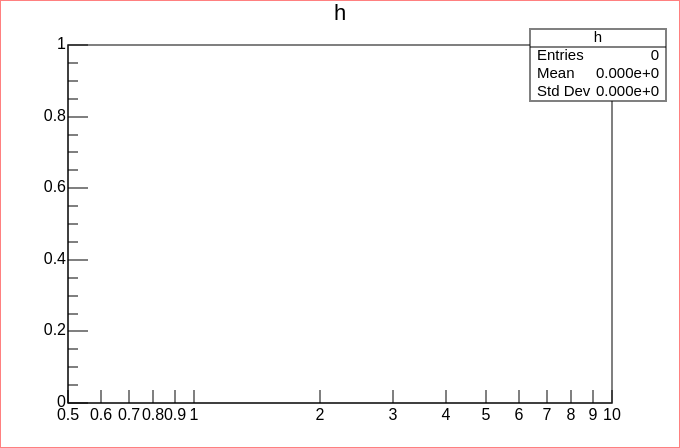
If you compiled ROOT with -Dwebgui=on -DCMAKE_CXX_VERSION=14, you also can use root --web macro.C. In this case JSROOT used for rendering and it provides output:
Probably we should ask our expert @couet if more ticks can be drawn on log scale.
There is method gStyle->SetNdivisions(510, "x");, but seems to be it has no effect for log scale.
If you just need to produce image file, you can draw TLine and TText objects at required places.