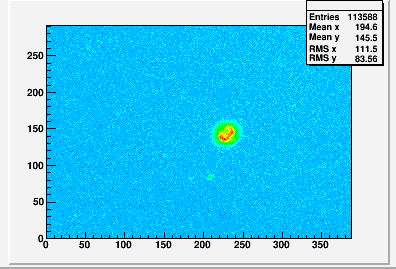
Hi, I have an array containing pixel intensities as integer values for a 128x128 sized image. Is it possible to plot this as a histogram that would look something like the following:
I would be able to convert the array to also contain (x,y) positions as well as intensity if this would help the plotting.