Hi All,
I’m about to delve into the idea of creating a way of storing vector field data and subsequently plotting it.
Specfically, the application is plotting measurements periodically made on a water column. The end result is that you get (X,Y,Z, Vx,Vy,Vz) .
Before I go bounding off into writing code to support this I’m just wondering what other people have done.
My thoughts are to use a 2 element TVector3D to store the data. Then drawing the data using arrows representing the spherical vector representation of the Vx,Vy,Vz at the data point.
This may not be the correct forum for this kind of communication so please let me know if I’m cluttering up the group.
I’ve been giving this some thought and have come up with the following scheme.
Given that what I would like to do is plot an arrow at a given space point, I have taken to the idea of extending the TH3 class with a VFGrid class. (Vector Field Grid) I started by copying much of the TH3 class over and eliminating what is not needed. However, much of the drawing and book keeping is already done by TH3.
So what I intend to do is have something like,
class VFGrid : public TH3 {
public:
VFGrid const char* name, const char* title, Int_t nbinsx, Double_t xlow, Double_t xup, Int_t nbinsy, Double_t ylow, Double_t yup, Int_t nbinsz, Double_t zlow, Double_t zup);
virtual ~VFGrid();
private
TVector3 *cells;
};
Granted this is quite elementary, The idea is to draw a 3d histogram but use the array of TVector3 (cells) to store the vector element. The corresponding histogram will be of zero size.
The draw function will be something like the THistPainter::PaintArrows in which at each cell center I will draw a 3-d arrow.
Is this overkill? Should I make a seperate class and just model it after the TH classes?
Hello Oliver,
I had thought of that. Ultimately what I want to do is have the data gridded and be able to extend the THistPainter class with some additiional drawing options.
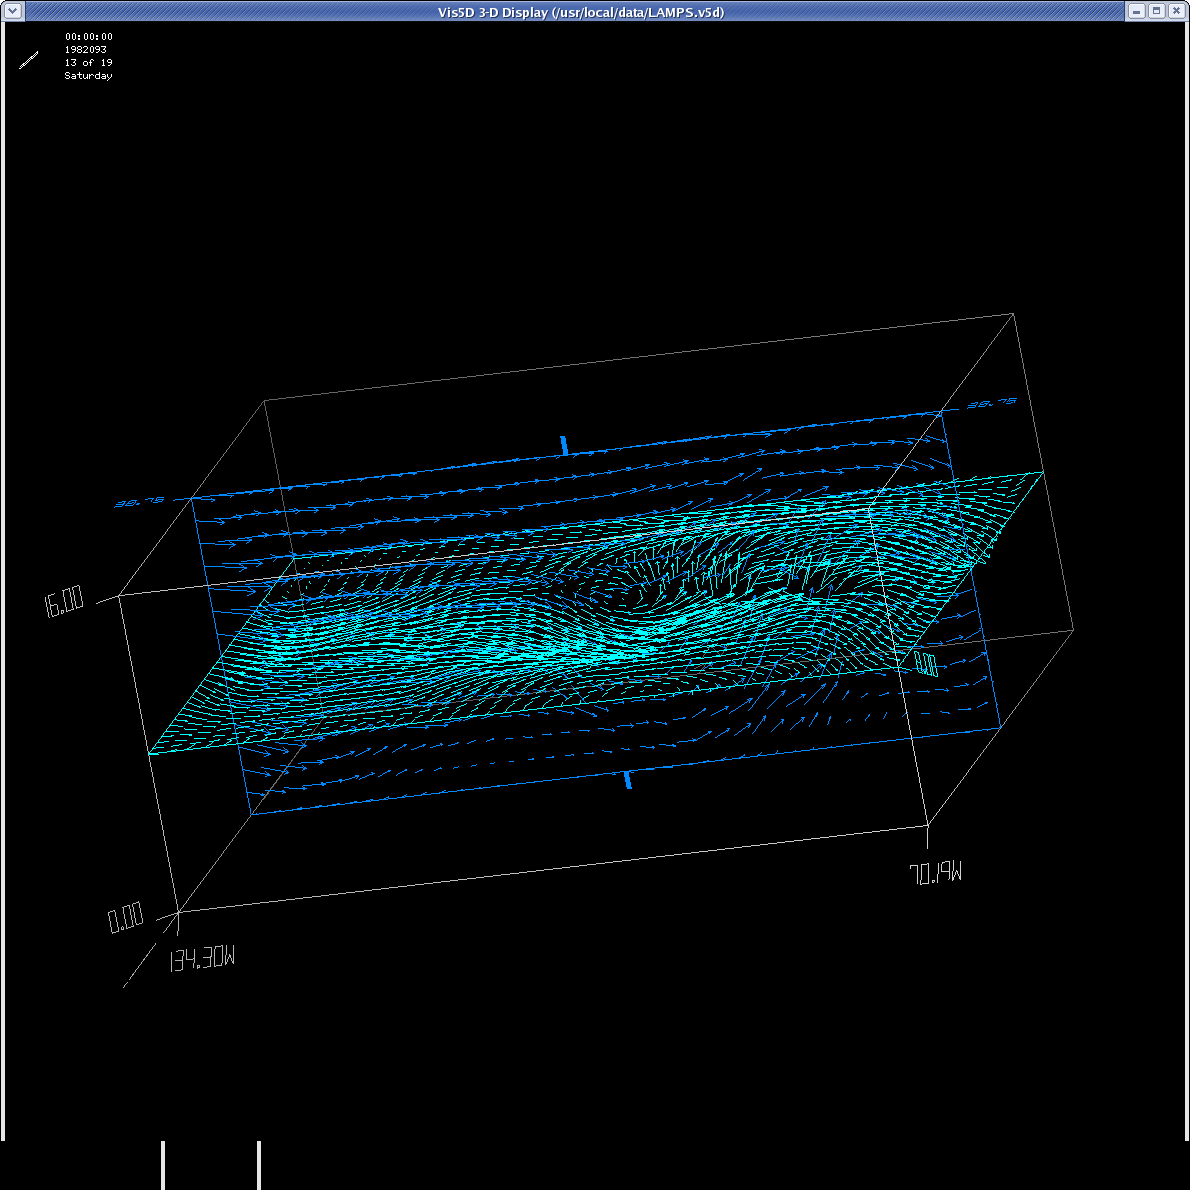
I’ve included a screen grab of a program called vis5d that shows some of the idea.
Each arrow has a position, magnitude and direction.
Thank you for taking the time to read and comment on my adventure.
Chris
Kind of, Currently the arrow method does the difference between cells to determine the magnitude and direction. Sort of like making voltage measurement to plot the electric field
The device I have directly measures a vector(V), so I’d like to impliment it such that the arrows plot V.Mag() and V.Dir()