I am looking to plot some lines using TGraph2D and check visually whether they intersect with a sphere. The trouble I am having is understanding how to plot a three-dimensional sphere on the same pad as a TGraph2D such that I can interactively rotate them. Any suggestions or ideas? Thanks.
How do you generates the sphere ? Which graphics option are you using to plot the TGraph2D ? May be you can provide a small script showing what you have done until now ?
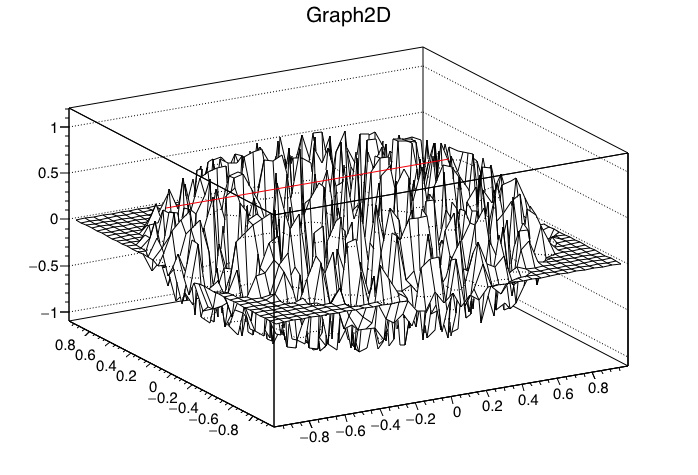
Here is an attempt, in python, but there is no reason to stay on this line of thinking. Currently, the biggest issue is the surface of the sphere. ANother issue is that it is hard to see where the line intersects with the sphere, or if it is simply in front or behind it. (There is also a weird issue with numpy transpose as input to TGraph2D, but we can ignore that for now.)
import numpy as np
import ROOT

#Create a sphere of radius 1.
radius = 1
sphere_points = np.random.randn(3, 10000)
sphere_points *= radius / np.linalg.norm(sphere_points, axis=0)
sphere = ROOT.TGraph2D(len(sphere_points[0]), sphere_points[0],
                        sphere_points[1], sphere_points[2])

#Array of points for line
line_points = np.array([[0.8, 0.4, 0.4], [-0.8, 0.4, 0.4]])
#We have to transpose this matrix to get rows of x, y, z
#Although this creates the right ordering it causes a TypeError in TGraph2D.
#line_points = np.transpose(line_points)
#We do this instead:
line_points = np.dstack(line_points)[0]

line = ROOT.TGraph2D(2, line_points[0], line_points[1], line_points[2])
line.SetLineColor(ROOT.kRed)

sphere.Draw("SURF")
line.Draw("LINE SAME")
ROOT.gPad.Update()
raw_input("Press Enter to exit...")
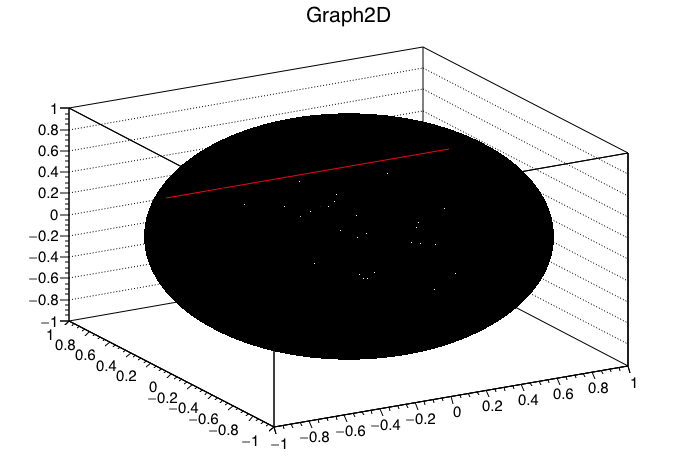
No way you can Draw a sphere with SURF or TRI option in a TGraph2D… With this options each (x,y) coordinates has only one Z coordinate (Delaunay triangulation). If you have several Z for one X,Y ( a sphere has 2) then you can only draw it using a cloud of point. P option … but I guess thats not what you want.
I’ve tried this as well, but you still can’t tell where the intersection is. It looks as though the ray is always on top of the sphere even when rotating it 180 deg! You also have to generate a large number of points to make the density high enough.
Is there some other primitive I can use to make a 3D sphere?
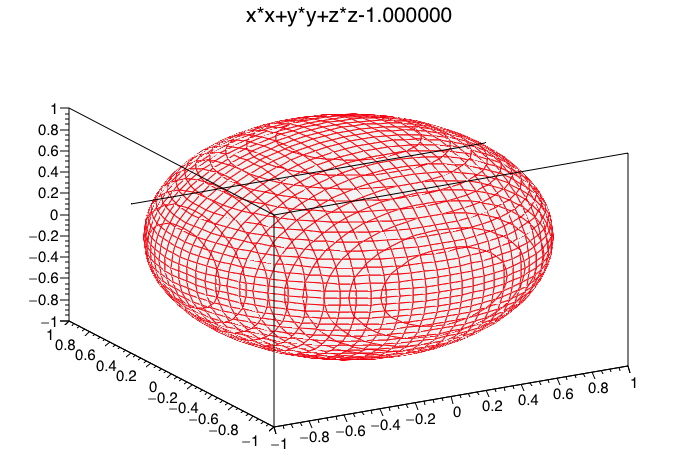
Promising!
First, There is a strange bounding box on the canvas that disappears when saving it as a png. Here is the screenshot prior to saving:
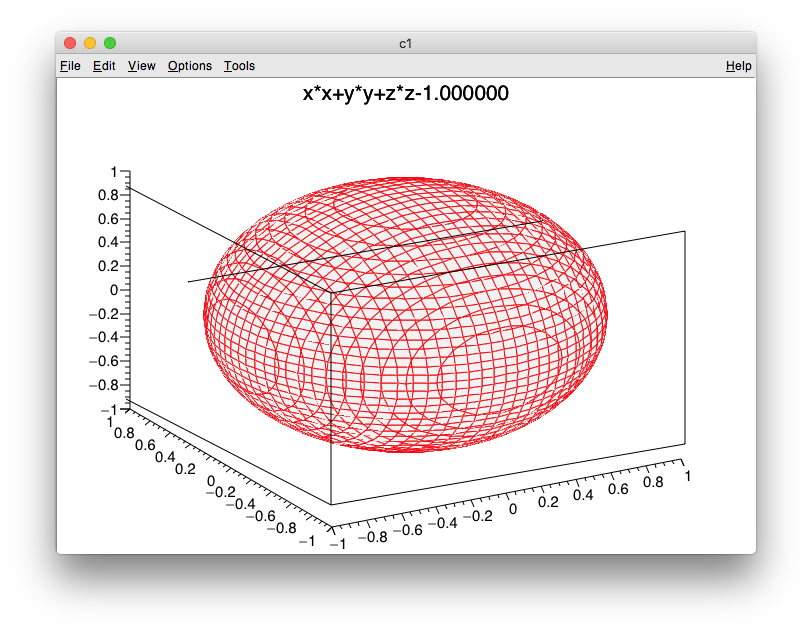
Secondly, are there any controls over the surface painting? I can still see through the sphere making it hard to tell where the intersection is.
import numpy as np
import ROOT

#Create a sphere of radius 1.
radius = 1
f3 = ROOT.TF3("sphere", "x*x+y*y+z*z-%f" % radius**2, -radius, radius, -radius, radius, -radius, radius)
#f3.SetClippingBoxOn(0,0,0)

#Array of points for line
line_points = np.array([[1, 0.4, 0.4], [-1, 0.4, 0.4]])
#We have to transpose this matrix to get rows of x, y, z
#Although this creates the right ordering it causes a TypeError in TGraph2D.
#line_points = np.transpose(line_points)
#We do this instead.
line_points = np.dstack(line_points)[0]

line = ROOT.TGraph2D(2, line_points[0], line_points[1], line_points[2])
line.SetLineColor(ROOT.kBlack)

f3.Draw("FBBB")
line.Draw("LINE SAME")
ROOT.gPad.Update()
raw_input("Press Enter to exit...")
This will not work … when you draw the line using SAME the sphere and the line “ignore” each other. It is not a 3D scene by itself it is just two pictures on top of each other. No way you can clip the line on the sphere this way. For this kind of thing you should use a 3D rendering system like OpenGL.
Disappointing, but still a solution. I’ll look into other solutions.
Is some particular case like this one adding a line on top of a 3D plot will work. but as you see in that example there is no clipping. In your case you would have to draw 2 lines Ie: kind of “doing yourself the clipping”
Thanks for the idea, I’ll investigate it.
Did you ever look into the bounding box issue when using "FBBB"? Seems that it might be a bug.
I need to check… looks like a bug, you are right,.
This topic was automatically closed 14 days after the last reply. New replies are no longer allowed.