Plotting a polar histogram, can't move axes or mark them in terms of pi

Hello,

I’ve been trying without success to plot a polar histogram showing a 2D projection of the surface of a hemisphere that looks pretty. This script is what I have so far:

[code]void polarPlot()
{
TRandom2 angles;
Double_t phi;
Double_t theta;
TH2D * PP = new TH2D(“polarHist”,“Angular Distribution”,360,-(TMath::Pi()), TMath::Pi(),90,0,TMath::PiOver2());

for (int i = 0; i < 10000; i++)
{
phi = angles.Gaus(0,1.6);
theta = angles.Gaus(0.8,0.3);

  PP->Fill(phi,theta);
}

PP->SetTitle(“A gaussian distribution over polar coordinates”);

TCanvas * c = new TCanvas(“c”,“c”,800,800);

TH2D * dummy = new TH2D("","",10,-TMath::Pi()/2,TMath::Pi()/2,10,-TMath::Pi()/2,TMath::Pi()/2);
dummy->SetStats(false);
dummy->Draw();
PP->Draw(“polcol2zsame”);

return ;
}
[/code]

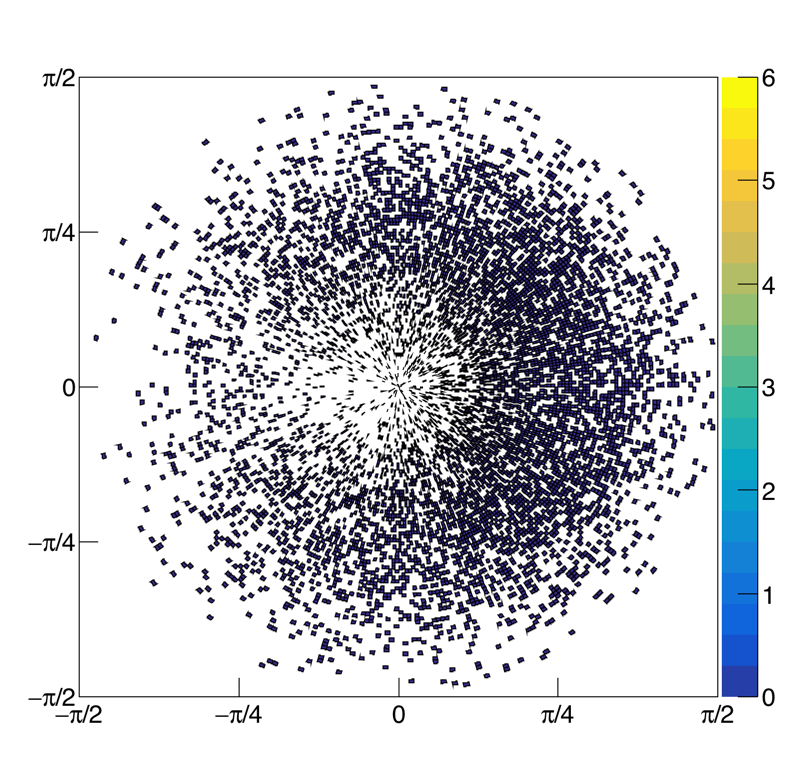
This does produce a circular distribution centred in the middle of the canvas, but it does have axes numbered 1,2,3 etc. which I would prefer to be labelled in terms of Pi, and the axes are on the bottom and left, while they might look nicer in the middle of the figure.

I’ve had a look through some of the root documentation and the forums, but haven’t found anything relevant, so I thought I’d ask the question directly.

// Since ROOT version 6.07/07:

void polarPlot()
{
   TRandom2 angles;
   Double_t phi;
   Double_t theta;
   TH2D * PP = new TH2D("polarHist","Angular Distribution",360,-(TMath::Pi()), TMath::Pi(),90,0,TMath::PiOver2());

   for (int i = 0; i < 10000; i++) {
      phi = angles.Gaus(0,1.6);
      theta  = angles.Gaus(0.8,0.3);
      PP->Fill(phi,theta);
   }

   PP->SetTitle("A gaussian distribution over polar coordinates");

   TCanvas * c = new TCanvas("c","c",800,800);

   // Draw the axis with Pi labels
   TH2D * dummy = new TH2D("","",10,-TMath::Pi()/2,TMath::Pi()/2,10,-TMath::Pi()/2,TMath::Pi()/2);
   dummy->SetStats(false);
   TAxis *Xaxis = dummy->GetXaxis();
   Xaxis->SetNdivisions(-4);
   Xaxis->ChangeLabel(1,-1,-1,-1,-1,-1,"-#pi/2");
   Xaxis->ChangeLabel(2,-1,-1,-1,-1,-1,"-#pi/4");
   Xaxis->ChangeLabel(5,-1,-1,-1,-1,-1,"#pi/2");
   Xaxis->ChangeLabel(4,-1,-1,-1,-1,-1,"#pi/4");
   TAxis *Yaxis = dummy->GetYaxis();
   Yaxis->SetNdivisions(-4);
   Yaxis->ChangeLabel(1,-1,-1,-1,-1,-1,"-#pi/2");
   Yaxis->ChangeLabel(2,-1,-1,-1,-1,-1,"-#pi/4");
   Yaxis->ChangeLabel(5,-1,-1,-1,-1,-1,"#pi/2");
   Yaxis->ChangeLabel(4,-1,-1,-1,-1,-1,"#pi/4");
   dummy->Draw();

   // Draw the data
   PP->Draw("polcolzsame");
}


Thanks for getting back to me, I added the section about TAxis to my code, but ROOT comes up with

“Error: Can’t call TAxis::ChangeLabel(1,-1,-1,-1,-1,-1,”-#pi/2") in current scope polarPlot.C:35:"

I’m not sure what the issue is as it doesn’t seem to have issue with “Xaxis->SetNdivisions(-4);”.

I’m running ROOT version 5.28, was the ChangeLabel not implemented in that version?

As I wrote at the beginning of the macro this as been implemented in 6.07/07

Ah. Oh dear. I’m not sure I can use modern versions of ROOT as all the other software I use is based on an older version. Thanks all the same though.

Yes … and even your “ROOT 5” version is old … i.e. 5.28 … the latest “ROOT 5” version is 5.34. We still patch that one in case of blockers…