Hello experts,
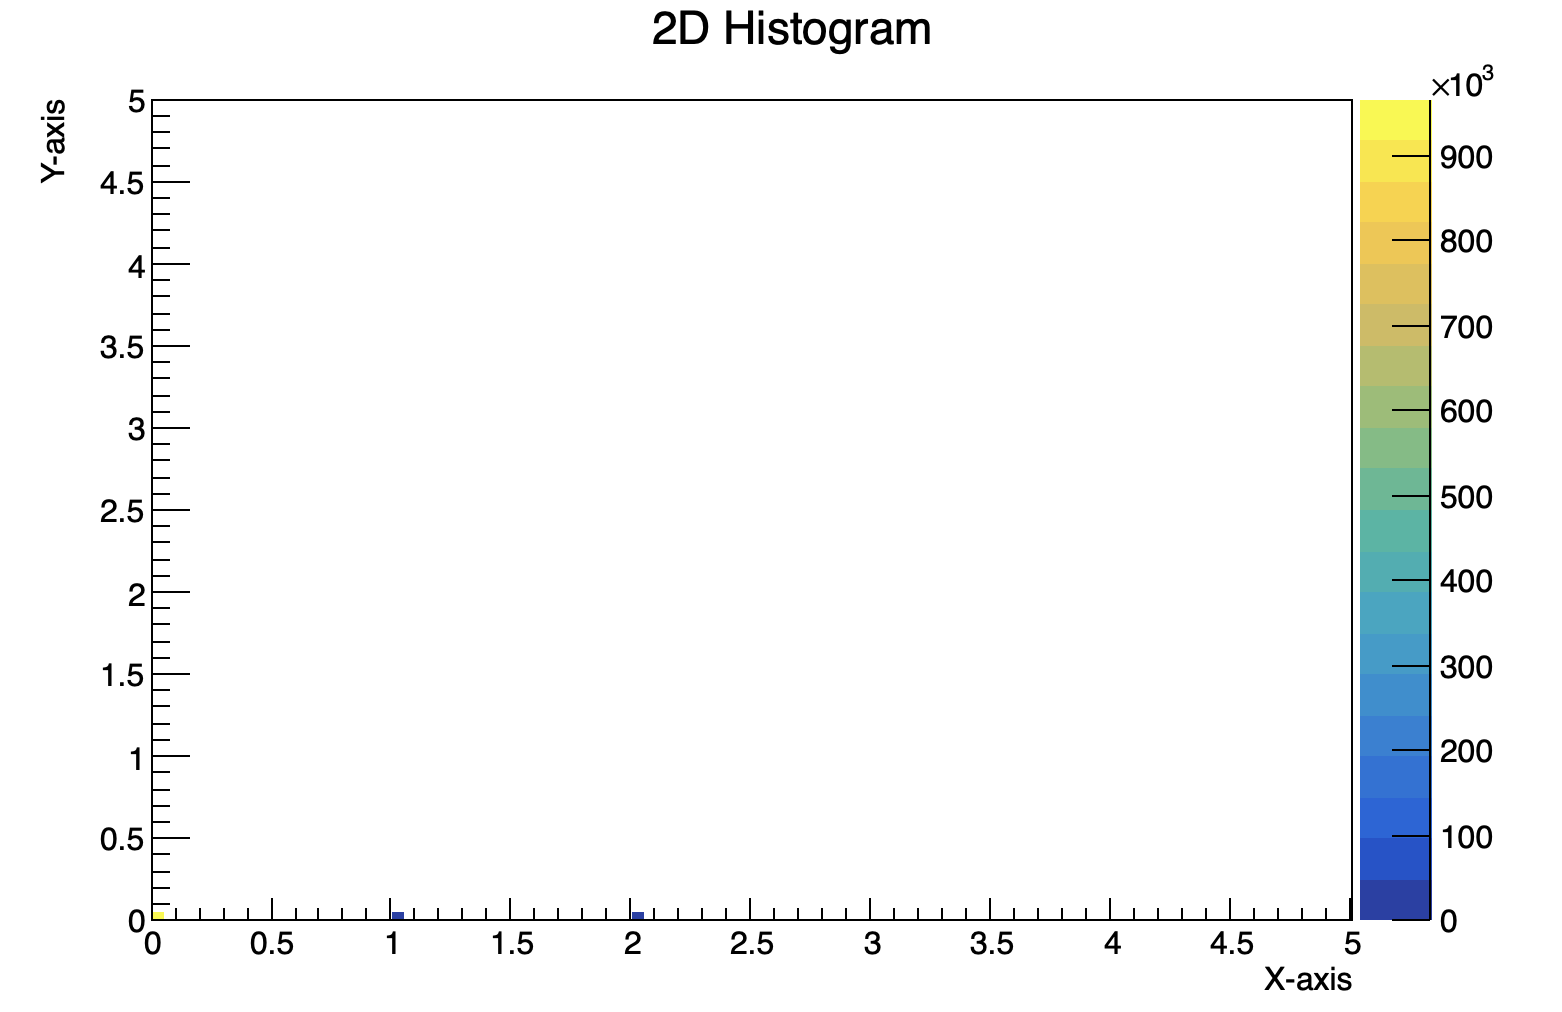
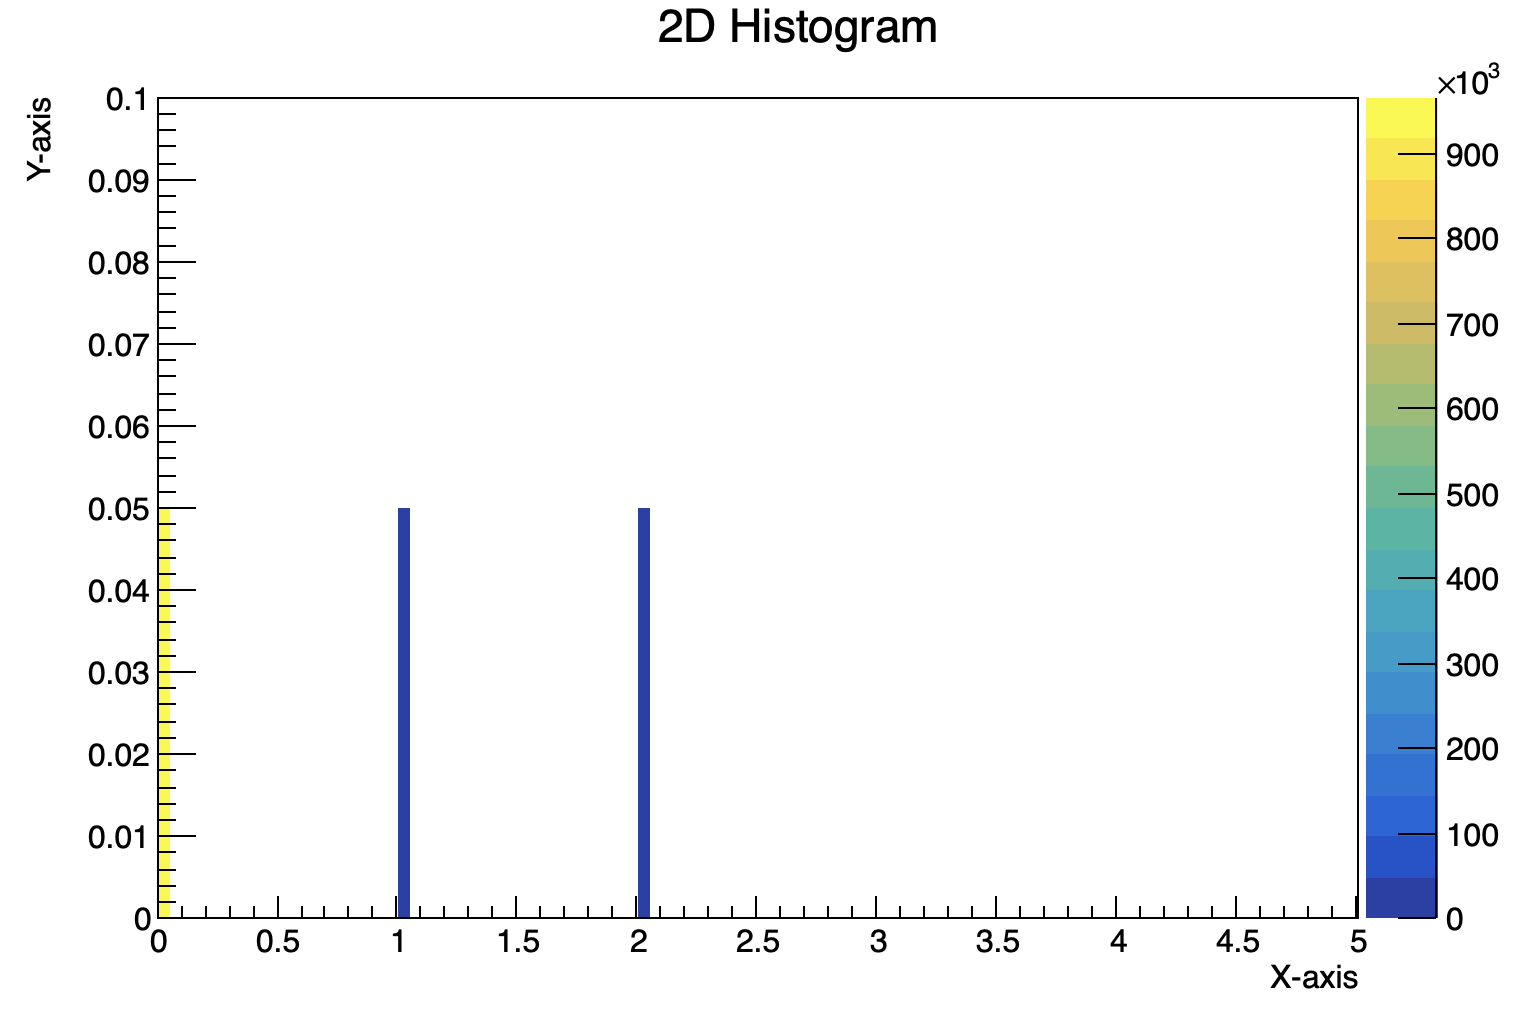
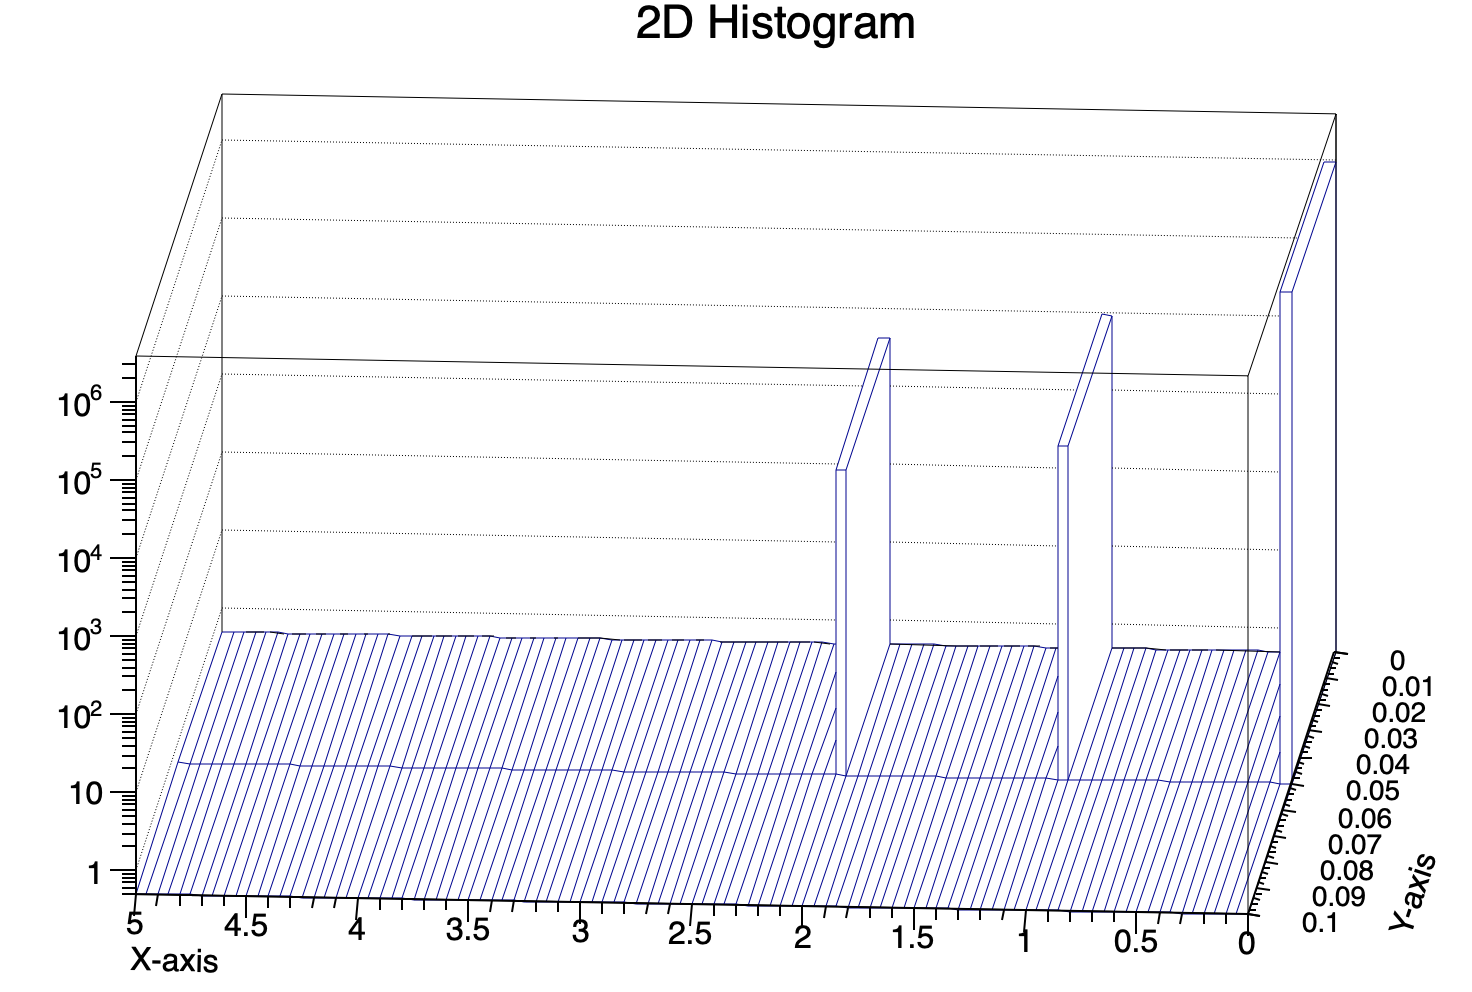
I was trying to plot a two-dimensional histogram from two one-dimensional histograms stored in two separate data files. The data is formatted in two columns with the first column containing the bin centre value and the second column containing the bin content. I want to plot them as a 2-D histogram and write a macro for that. I am not sure what is the mistake in it and why it doesn’t work fine. I am attaching my data files and the root macro along with this post. fill2dhisto.c (2.3 KB) 1.txt (11.1 KB) 2.txt (11.1 KB)
Reading your post, I am not sure what you really want to do. You said you want to plot a two-dimensional histogram from two one-dimensional histograms.
But how would you like to create a 2D histogram from two 1D histograms ? 1D histograms are similar to 1 dimensional arrays whereas 2D histograms are similar to 2D matrices. You cannot make 2D matrix from two 1D arrays.
Note: When I click on 1.txt I get 2.txt. You posted twice the same file.
Hello,
Thanks a lot for your quick reply. I am sorry for the unclear parts of my question. I was conducting an experiment with a dE-E detector telescope (Two particle detectors stacked together). What I get out from these detectors is the energy deposition on each detector as the 1D spectrum. Usually, we plot it as a 2D histogram with the energy spectrum the first detector on the x-axis and the second detector on the y-axis. I had posted only the data from only one detector previously. I am posting the energy deposition data from both the dE and E detectors along with this post. 11.txt (11.1 KB) 12.txt (11.1 KB)