I have a list of points in a three-dimensional space which describe a (closed) surface. The points are not distributed on a grid but can be spaced randomly. What I would like to do is to draw this closed surface (the envelope of the points) in some 3D plot.
I have tried to read the data to a TGraph2D and then draw this graph with the various “surf” drawing options, but I am running into troubles with this. First of all, the number of points (approx. 300) already seems to be so large that drawing takes a very long time. And then, more importantly, the surface drawing interconnects the points in a wrong way so that I do not get the envelope surface of all the points but something very complicated.
I understand that this is somehow an ill-posed problem and not a fault of the TGraph2D, since it cannot know in which order to points belong together. But still, do you have any idea how I could get to a drawing of the surface I need?
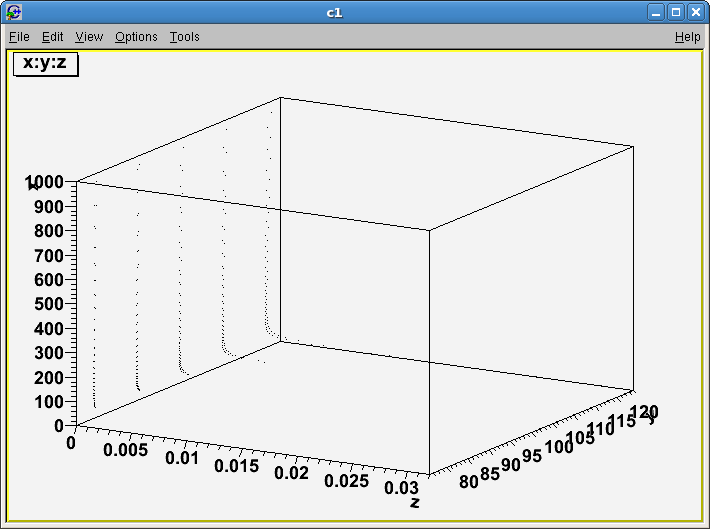
I have attached the text file with my data and a very small macro to show what I am doing. If you only plot the points and not the surface, it is probably obvious how the desired result should look like. The surface has a banana-like shape in the x-z-plane and extends smoothly in y-direction. In particular, this means that for any pair (x,y), there are two z-values on the surface.
thanks for your reply. I have seen that TH3 exists, but the documentation mentions that it can only draw the points, not a surface. Is this not true anymore? Or is there another way to render a closed surface from a list of points?
From a list of points making a closed surface there is nothing specific. The TH3 can be rendered using GL and then you can use box plot (see example is $ROOTSYS/tutorials/gl)
when you plot the points that I have posted, you see that a certain number of points is given for discrete y-values. For each y-value, the corresponding points are on a kind of banana in the x-z-plane. The TGraph2D displays this correctly.
The problem is only when I try to do a surface plot. I could give the “bananas” for all y-values if you want, and they all would lie on a certain surface which I would like to render.
Well, what I wanted to say is you should split your array to draw the “roof” and the “basement” separately.
You should be in possession of some “extra knowledge” about the topology of your data points to apply. Otherwise what TGraph2D shows is “correct” and your “banana” perception is just an optical illusion. For example, why there should be one banana rather two nested ones with the tiny gap between them.
If there is an extra criteria but you do not know how to apply it then ask the Forum.
Yes TGraph2D will display correctly the data set as points but will not if you ask to display it as a surface (TRI oprtion) because the Delaunay algorithm used in the class is not meant to do that (see help).
yes, you are both right of course. Sorry Valeri, I first did not get your point.
Splitting the bananas into a “roof” and a “basement” would be an option, but I guess in the end it will also not solve the problem, since the surface can get more complicated and not just separable into roof and basement. What I would need is probably a more general way to define how my points are connected, but if I understand it correctly, something like this is not foreseen in ROOT. Or did I miss anything?
Yes, I did. Maybe I lack understanding of the examples, but I could not find an example which looked applicable to by problem. In particular, I could not get TH3 doing what I want. Could you maybe say a few words about how you would apply GL to this case? Thanks a lot?
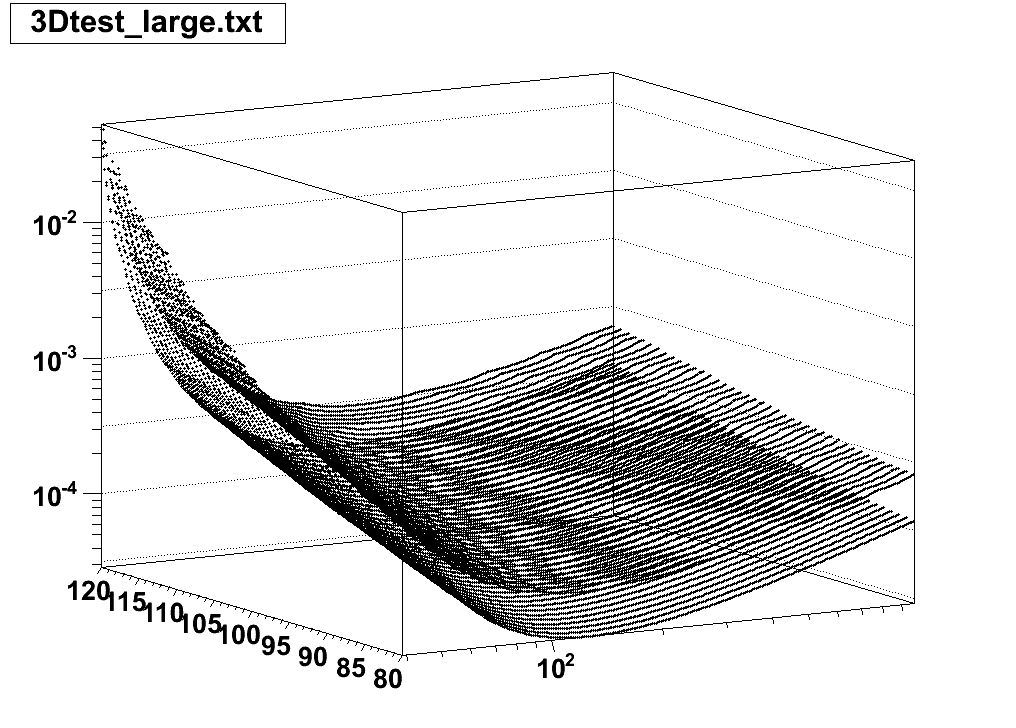
Well, you will at least need logx and logz to see anything. Moreover, I can of course provide a more dense set of points, in particular at more y-values, see the attachment.
Of course I am also happy to give a better task description if you tell me what is unclear.
Unfortunately, there is no direct way. You have to put your data into TTree with
5 branches, the 4-th variable should be some fixed value, like 1.0 for example; the 5-th can have any value. Fill this tree from your points and draw it
with Draw(“x:y:z:v4:v5”, “”, “gl5d”); treegen.C (681 Bytes)
Thanks a lot for the hint! I did not know this gl5d option exists.
In my case, I still cannot see the surface you posted when I run your macro. I just see the points and I get the messages
Info in <TGL5DDataSet::TGL5DDataSet>: Number of selected rows: 23735
Info in <InitGeometry>: min = 1, mean = 1, rms = 0, dx = 0
Info in <TGL5DPainter::InitGeometry>: Iso-level 1, range is 0 ...
Warning in <TGL5DPainter::AddSurface>: Too little points: 0
Info in <TGL5DPainter::InitGeometry>: Iso-level 1, range is 0 ...
Warning in <TGL5DPainter::AddSurface>: Too little points: 0
Info in <TGL5DPainter::InitGeometry>: Iso-level 1, range is 0 ...
Warning in <TGL5DPainter::AddSurface>: Too little points: 0
Info in <TGL5DPainter::InitGeometry>: Iso-level 1, range is 0 ...
Warning in <TGL5DPainter::AddSurface>: Too little points: 0
Do you have any idea why this is different? Which ROOT-version are you using? (5.26/00 in my case)
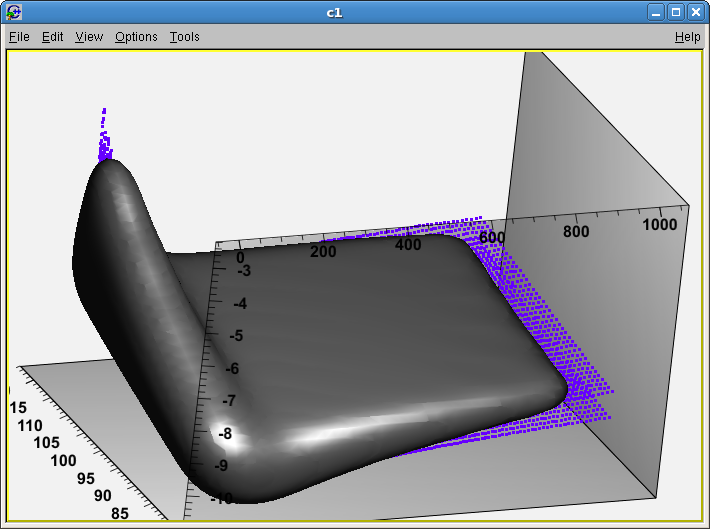
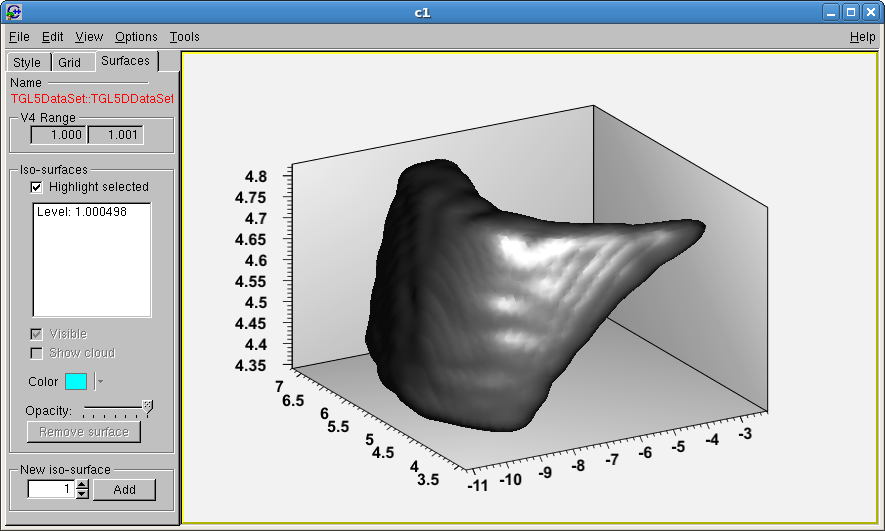
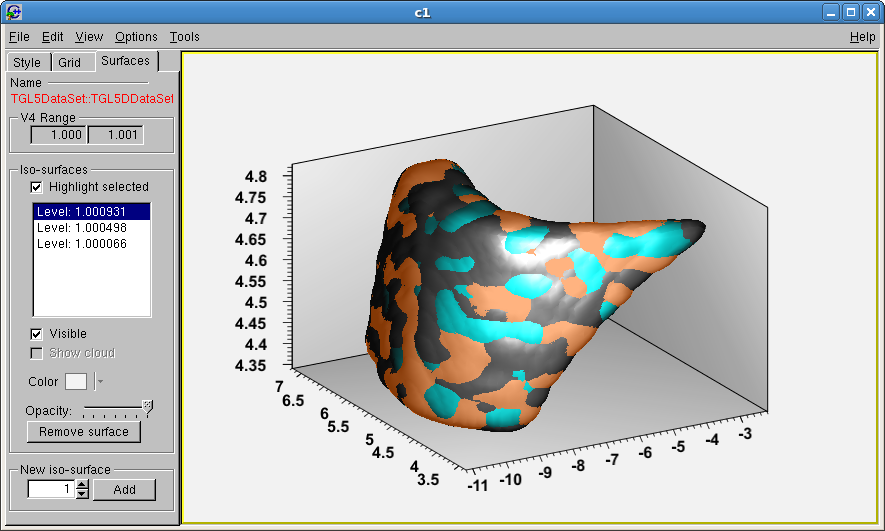
What you can do - add some random number to v4. After that, you’ll probably have several surfaces instead of one (pic. 1), using canvas editor (pic.2) you can remove them and have only one again (pic. 3). treegen.C (720 Bytes)