Plotting 1D histograms behind each other

Dear all,

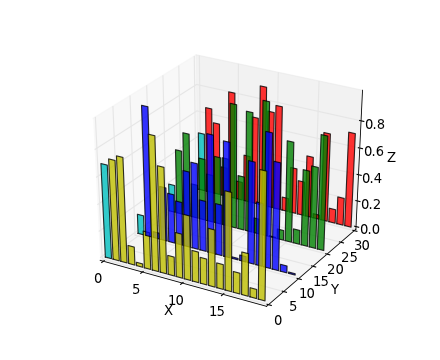
I have a set of 1D histograms which represent the evolution of a distribution in a certain discrete parameter (e.g. in steps of time). I would like to plot these histograms behind each other in a 3D plot (see attachment for an example). Is ROOT capable of doing this?

If not, can you suggest another similar way of visualizing this kind of data? I know about THStacks, but I find it much harder to grasp the shape of the distributions from a stacked histogram. I also have tried to fill the data in a TH2, but I this does not allow to have different colors for each bin in y (i.e. for each histogram).

Thanks a lot for any help,

Sven

The way to do it with root would be to make several TH2 inside a THStack, like in the following example:

{
        Int_t n  = 39;
        Int_t nb = 7;
        TH2D *hist[n];
        THStack *a = new THStack("a","LegoPlot");

        for(Int_t ihist=0; ihist<n; ihist++ ) {
              TString hn="hist_"; hn+=ihist;
              hist[ihist] = new TH2D(hn,hn,nb,0,nb,10,0,10);
              hist[ihist]->SetBinContent(ihist+1,ihist,double(ihist));
              hist[ihist]->SetBinContent(ihist  ,ihist,double(ihist));
              hist[ihist]->SetBinContent(ihist-1,ihist,double(ihist));
              hist[ihist]->SetFillColor(ihist);
              a->Add(hist[ihist]);
        }
        a->Draw("LEGO10");
}

Hi!

Thanks a lot for this hint! I somehow did not think of this obvious possibility. Works like a charm :slight_smile:

Sven