I am generating TOY MC with one specified model by keeping the yields fixed for signal and background. The fitting is done by the same model but the yields are now floated.
plotParamOn() and plotError() are giving the distributions. But when I try to get the plotPull() , its giving the segmentation violation. Any suggestions are most welcome. The error is
[#0] ERROR:InputArguments – RooDataSet::getRange(fitParData) ERROR: unknown variable: nsig_fpull
[#0] ERROR:InputArguments – RooDataSet::moment(fitParData) ERROR: unknown variable: nsig_fpull
[#0] WARNING:InputArguments – RooDataSet::fitParData:fillHistogram: WARNING: data does not contain variable: nsig_fpull
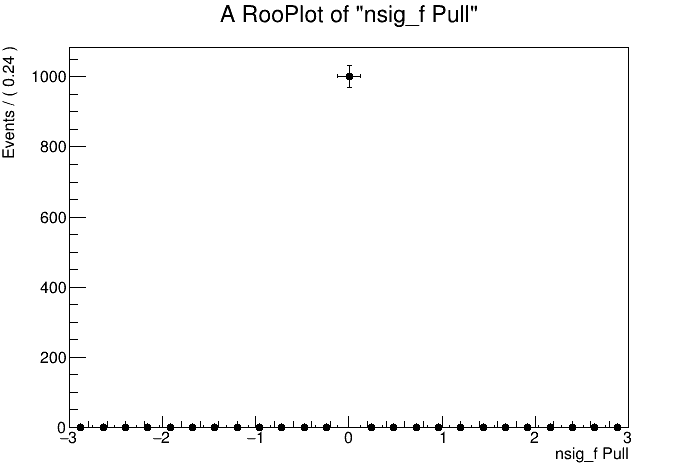
the crash is caused by a bug. This will be fixed in the next version of ROOT. However, even after fixing this bug, the pull plot is not really meaningful as you can see from the attached file.
the problem is that the fitted model and the model for generation do not share the same observables. Therefore, RooFit does not find any pull data for nsig_f, because this will only be generated for nsig.
The solution is already in your code. Move from
RooMCStudy* mcstudy = new RooMCStudy(model,model_f,x,"","mhv");
to
RooMCStudy* mcstudy = new RooMCStudy(model_f,x,Binned(kTRUE),Silence(),Extended(),
	FitOptions(Save(kTRUE),PrintEvalErrors(0))) ;
It’s me again. My question is about RooMCStudy with MINOS. MINOS corresponds to the asymmetric error. When the pull-distribution is made in this case with plotPull(), is it taking into account the asymmetric errors? If it cares the asymmetric errors then which one is taking +ve or -ve?
Now I am doing some toy study with signal yield 0. So there are asymmetric errors in the fit yield. When I am making the pull-distribution from the fit, it’s asymmetric also. So is it possible to make the pull-distribution symmetric one? The distribution is attached here…nsig_pull.pdf (15.6 KB)
In your plot, you see that it’s taking both. Look at the point above -6. It has asymmetric errors.
As to your second question:
Do you want symmetric pulls or symmetric errors? If I understand correctly, you are asking for the pull. If the signal goes towards zero, there is no way to not make it symmetric because 0 is the lower bound for the amount of signal. Unless you are happy with a negative amount of signal, you are stuck with an asymmetric distribution.
Actually, when the fit is done by MINOS, it calculates the asymmetric errors(two values, +ve & -ve) on the parameter. Now the pull = (fit value - true value)/(error on the fit value). So my question is out of this two error values, which error is used for pull calculation or anything else? Yah I looked at the documentation, but not mentioned about which error is taken explicitly for pull calculation.
I expect the pull-distribution to be symmetric if the error is taken correctly from the fit error values of the parameter.
Ok, I understand now. Depending on whether the measurement is larger/smaller than the true value, it’s using the low/high asymmetric error. This is the code that calculates the pull:
  if (meas.hasAsymError()) {
    Double_t delta = _meas-_true ;
    if (delta<0) {
      return delta/meas.getAsymErrorHi() ;
    } else {
      return -delta/meas.getAsymErrorLo() ;
    }
  } else if (meas.hasError()) {
    return (_meas-_true)/meas.getError() ;
  }
Thank you very much for your crucial information!! plotPull() is taking care of the asymmetric errors on the parameter. Also, these criteria choose the one, whose pull value is very much close to that of parabolic errors.
I have another question connecting to this, plotError() in RooMCStudy only plots the parabolic errors. Is it possible to plot the low and high errors separately?