plotOn of a RooDataHist with different kinds of errors

Dear RooFit experts,

I’m having some trouble understanding exactly what happens when asking for plotOn of an imported TH1 with variable bin size when asking for different error configurations. This is not what I’m ultimately trying to do, but I have the feeling it’s connected to the behaviour I’m seeing when trying to perform a chi2 fit to this same histogram.

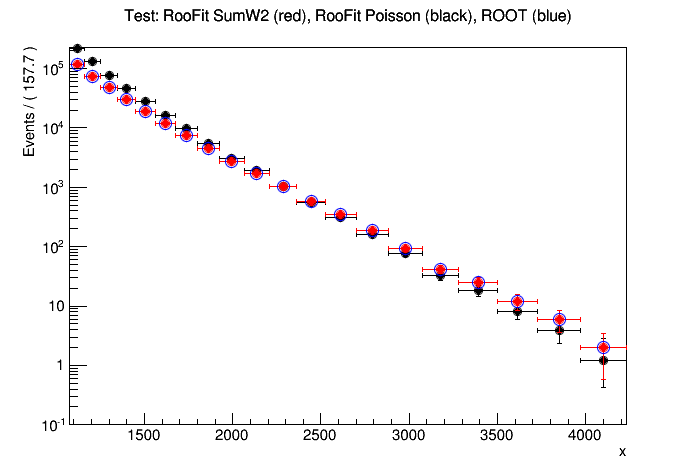
I’m trying to plot exactly the same histogram, but instead of changing the errors it’s the data points that move when asking for

data.plotOn(xframe,DataError(RooAbsData::Poisson)) 

instead of

data.plotOn(xframe,DataError(RooAbsData::SumW2)) 

I don’t see this behaviour when using RooDataSet. The code I am using is below, and the output (test.png) is attached. If needed, I can add the root file to run the example. I’d be grateful if anyone could explain me exactly what is happening here.

Thanks,
Caterina

#include "TFile.h"
#include "TH1D.h"
#include "RooRealVar.h"
#include "RooDataHist.h"
#include "TCanvas.h"
#include "RooPlot.h"

using namespace RooFit;

int main() {
        
        TFile* fin = TFile::Open("dijetMass_data_2012.root","READ");
	
        // extract histogram
	TH1D* hist = (TH1D*) fin->Get("mass_0");
        
        // Declare observable x
        RooRealVar x("x","x",1076,4100);
                
        //turn the histogram into a RooHist
        //do not do density correction so it's comparable to ROOT's own histogram
        RooDataHist data(hist->GetName(), hist->GetTitle(), RooArgSet(x), Import(*hist, kFALSE));
        
        // Overlay RooFit...
        TCanvas c;
        c.Clear();
        RooPlot* xframe = x.frame(Title("Test: RooFit SumW2 (red), RooFit Poisson (black), ROOT (blue)")) ;
        
        data.plotOn(xframe,DataError(RooAbsData::Poisson)) ;
        data.plotOn(xframe,DataError(RooAbsData::SumW2), MarkerColor(kRed), LineColor(kRed)) ;
        xframe->Draw();
        gPad->SetLogy();
        xframe->SetMinimum(0.1);
        
        //...with Root
        hist->SetMarkerColor(kBlue);
        hist->SetMarkerStyle(kOpenCircle);
        hist->SetMarkerSize(1.5);
        hist->Draw("sameP");
        c.SaveAs("test.png");
        
}


I noticed a

fin.Close()

missing in the macro, it will segfault during garbage-collection otherwise.

Besides this, any idea on what is happening?

Thanks,
Caterina

When you do a “plotOn” for a RooDataHist, you will generate a RooHist object, which is actually a TGraphAsymmErrors in disguise.

This RooHist object has the option of correcting for the bin widths or not. When enabled, for variable bin widths it will scale the bin contents of bin i by: nominalBinWidth/binWidth_i where nominalBinWidth is either user specified, or in the default case is taken as xAxisRange/nBins.

So what you see if the narrower-than-average bins are scaled up, and the wider than average bins are scaled down. This means that the y-axis label is correct: your plot has “Events / (157.7)”, 157.7 is the nominal bin width… so in the case of a bin being width = 100, say, then you scale up the bin contents by 157.7/100 so that the y-axis label is representing things accurately.

For poisson errors, this correcting for bin widths cannot be disabled!
For sumw2 errors, you have the option of switching the correction on or off. By default the correction is off (hence the sumw2 plot you did has the same bin contents as the input histogram). However I cannot find a nice way to switch it on via the “plotOn” method. Instead you would have to create the RooHist object by hand and “addPlotable” it to the RooPlot. See the following code for examples:

{
  using namespace RooFit;
  double bins[3] = {0,3,10};
  TH1D* hist = new TH1D("hist","hist",2,bins);
  hist->Sumw2();
  hist->Fill(0.5,1000);hist->Fill(7,100);
  RooRealVar x("x","x",0,80);  

  RooDataHist data(hist->GetName(), hist->GetTitle(), RooArgSet(x), Import(*hist, kFALSE));

  TH1* t = data.createHistogram("t",x); //makes the internal histogram

  //the last parameter in these calls is whether or not to correct for bin width
  RooHist *h_poissonErr_corrected = new RooHist(*t,0,1,RooAbsData::Poisson,1.,true);

  RooHist *h_poissonErr_uncorrected = new RooHist(*t,0,1,RooAbsData::Poisson,1.,false);  //THIS IS THE SAME AS 'corrected'... POISSON FORCES BIN WIDTH CORRECTION

  RooHist *h_sumw2Err_corrected = new RooHist(*t,0,1,RooAbsData::SumW2,1.,true);

  RooHist *h_sumw2Err_uncorrected = new RooHist(*t,0,1,RooAbsData::SumW2,1.,false);  //This is the same as the original histogram


  //plot all these RooHist
  h_poissonErr_corrected->SetMarkerColor(kBlack);h_poissonErr_corrected->SetLineColor(kBlack);
  h_poissonErr_uncorrected->SetMarkerColor(kRed);h_poissonErr_uncorrected->SetLineColor(kRed);
    h_sumw2Err_corrected->SetMarkerColor(kBlue);h_sumw2Err_corrected->SetLineColor(kBlue);
  h_sumw2Err_uncorrected->SetMarkerColor(kGreen);h_sumw2Err_uncorrected->SetLineColor(kGreen);
  
  RooPlot* frame = x.frame();

  frame->addPlotable(h_poissonErr_corrected,"P");
  frame->addPlotable(h_poissonErr_uncorrected,"P");
  frame->addPlotable(h_sumw2Err_corrected,"P");
  frame->addPlotable(h_sumw2Err_uncorrected,"P");
  frame->Draw();
}

Will