Ploting Y-axis in semi log

I am trying to set y axis in semi log and leave x axis as it is. Here is my code.

{
	
	double_t x;
	double_t L = 50;
		
	TF1* f1 = new TF1("f1", "[0]*TMath::sin(x)", 0, 50); 
	f1->SetParameter(0, L);
	f1->SetLineColor(kBlue+2); 
	f1->SetLogy();
	f1->SetTitle("Title; X-axis; Y-axis"); 
	f1->Draw(); 
}

Thank you.

Try this:

{
	TCanvas *c = new TCanvas();

	double_t x;
	double_t L = 50;
		
	TF1* f1 = new TF1("f1", "[0]*TMath::Sin(x)", 0, 50); 
	f1->SetParameter(0, L);
	f1->SetLineColor(kBlue+2); 
    f1->SetTitle("Title; X-axis; Y-axis"); 
	f1->Draw();
       // gPad->SetLogy(); 
}

Can you restate what you want to do? Sin(x) runs over (-1,1) and a log-plot won’t work for the negative values of sin(x).

I want the y-axis in semi log.


{
	
	double_t x;
	double_t L = 50;
		
	TF1* f1 = new TF1("f1", "TMath::Exp(-5e-2*[0]*TMath::Sqrt(10*TMath::Sq(x)-TMath::Sq(054))/9*TMath::Sq(x))", 0, 50); 
	f1->SetParameter(0, L);
	f1->SetLineColor(kBlue+2); 
	pad2->SetLogy();
	f1->SetTitle("Title; X-Axis; Y-Axis"); 
	f1->Draw(); 
}

To plot the y-axis in log scale and the x-axis in linear scale, you can uncomment the

// gPad->SetLogy()

line in my code. You will get an error running this, as you will be asking ROOT to plot the log of a negative number, which is incalculable with real numbers only. (TMath::Log(-1) = nan)

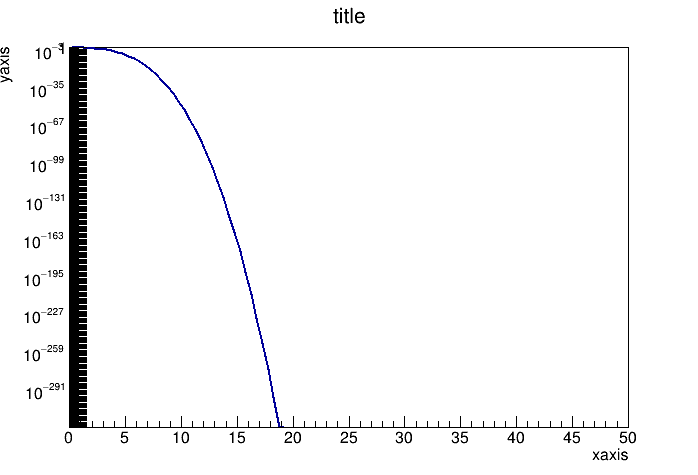
Here is an example that generates a plot of a function of my own choosing in semi-log axes. The values that I am plotting are always positive, which allows the log scale to work, as all points in the plot have mathematically-real numerical values.

void codeForTHESCIENTIST(){

  TCanvas *c = new TCanvas();

  double_t x;
  double_t L = 50;

  TF1* f1 = new TF1("f1", "TMath::Exp(-1.*x + 15) + TMath::Exp(-.05*x)", 0, 50);
  f1->SetParameter(0, L);
  f1->SetLineColor(kBlue+2);
  f1->SetTitle("Title; X-axis; Y-axis");
  f1->Draw();

  gPad->SetLogy();
}

Thank you. I changed my formula and it kinda worked but there is some kind of glitch in my graph.

I believe the glitch you mention is that the axis tick-marks are overlapping, leading to the appearance of a solid black bar. Notice how the range is some ~300 orders of magnitude. I’d recommend setting a smaller range of the y-axis that you’re most interested in, so you aren’t squishing the axis tick-marks together.

1 Like

Oh okay. Thank you.

I have one last question. How do I set a range for y-axis in log form?

f1->GetYaxis()->SetRange(10e-100,10e-150);

This does not seem to work.

Hmm. I don’t use TF1 much. I don’t know about how to do this if you don’t have access to a GetYaxis() function. You could change the draw x-range by

f1->Draw(0,5)
{
  TCanvas *c = new TCanvas();

  double_t x;
  double_t L = 50;

  TF1* f1 = new TF1("f1", "TMath::Exp(-1.*x + 15) + TMath::Exp(-.05*x)", 0, 50);
  f1->SetParameter(0, L);
  f1->SetLineColor(kBlue+2);
  f1->SetTitle("Title; X-axis; Y-axis");
  f1->Draw();

  f1->GetYaxis()->SetRangeUser(1,100);
  gPad->SetLogy();
}

This topic was automatically closed 14 days after the last reply. New replies are no longer allowed.