Hello Everyone, I have several cuts from a two-dimensional histogram. It is in array form and is created using SetPoint. I would like to plot all the cuts on the same 2D histogram, I wonder how is it possible.
Just plot the 2D histogram and then for each Graph “g” do:
g->Draw(“L”);
Nope, it didn’t show any cuts or graphs on the histogram.
My cuts are, cutg[i]->SetPoint(ncutpts,x[0],y[0]);
and I used following script to draw,
//test script for cuts graph
TCanvas *c1 = new TCanvas(“c1”,“c1”);
c1->cd();
//cutg[1]->Draw("");
for(Int_t k=2;k<50;k++){
cutg[k]->Draw(“L”);
}
Thanks for replying!!
TCanvas *c1 = new TCanvas(“c1”,“c1”);

cutg[1]->Draw("AL");
for(Int_t k=2;k<50;k++){
cutg[k]->Draw(“L”);
}
1 Like
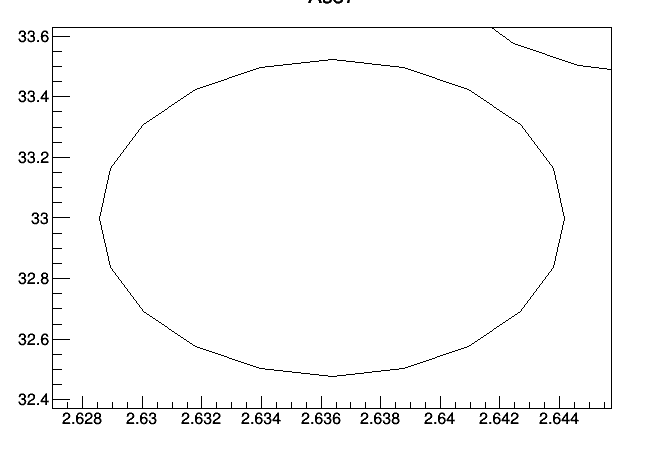
it shows only one cut/graph within its limit range, others are skipped. How can I specify the horizontal (2.5 to 2.9) and vertical limit (28 to 35), because it’s a canvas
Yes it is because the first graph limits are not large enough.
You should group your graphs in a TMultiGraph:
https://root.cern.ch/doc/master/classTMultiGraph.html
This topic was automatically closed 14 days after the last reply. New replies are no longer allowed.