By default Range() sets both the plot range and the normalization range
(which ‘lifts’ the curve in your example). By setting the second argument to kFALSE, you instruct plotOn() to keep the original normalization ranges (which is the full plot Range())
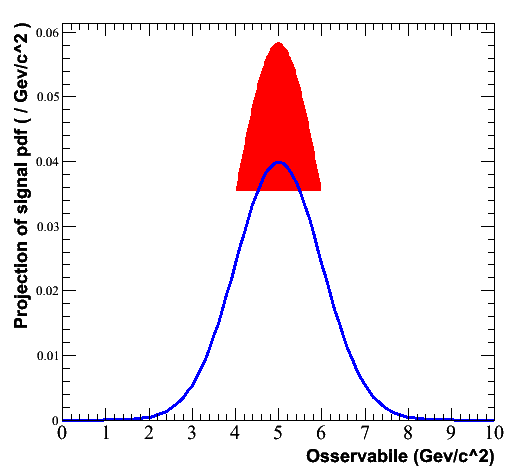
The second modification (VLines()) adds vertical lines downward at the end points of the curve, so that the filled curves filles all the way to zero.
(This reflects that a RooPlot contains TGraphs, which is a lower level
graphics object than e.g. a TH1)