Hi experts,
My PDF is a high-dimensional PDF, but I just want to plot the distribution of time t in it , so I use the following code:
weight = new RooRealVar(Weight, "", -10, 10);
varlist = new RooArgList(*t, *Resolutionsigma, *qf, *CPfinalstate,*EtaSS, *EtaOS, *TagdecOS, *TagdecSS, *weight);
RooArgList *varlist_plot = new RooArgList( *qf, *CPfinalstate,*EtaSS, *EtaOS, *TagdecOS, *TagdecSS, *Resolutionsigma);
wdata_LL = new RooDataSet("wdata_LL", "weighted data", *varlist, Import(*seltree_LL), WeightVar(*weight));
wdata_DD = new RooDataSet("wdata_DD","weighted data", *varlist, Import(*seltree_DD), WeightVar(*weight));
...
double nLL = combData->sumEntries("sample==sample::LL");
double nDD = combData->sumEntries("sample==sample::DD");
double numLL = wdata_LL->sumEntries();
double numDD = wdata_DD->sumEntries();
cout <<"the number of sample::LL: "<< nLL<<endl;
cout <<"the number of sample::DD: "<<nDD <<endl;
cout <<"the number of LL: "<< numLL<<endl;
cout <<"the number of DD: "<< numDD<<endl;
RooDataSet* llData = (RooDataSet*)combData->reduce("sample==sample::LL");
std::cout << "Unweighted number of LL entries = " << llData->numEntries() << std::endl;
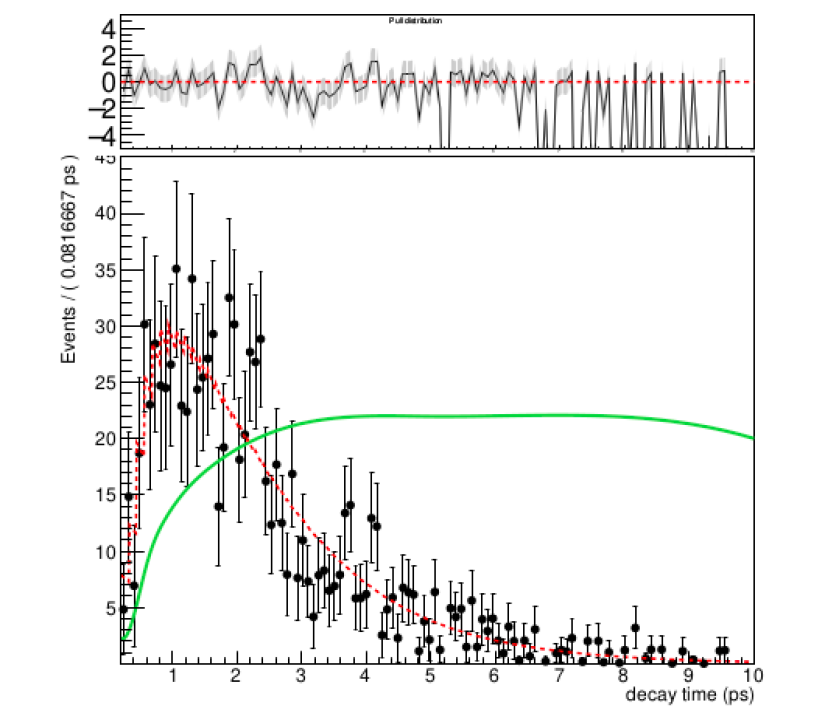
RooPlot *frame_LL = t->frame(Bins(90),Title("LL sample"));
//combData->plotOn(frame_LL,Cut("sample==sample::LL"),DataError(RooAbsData::SumW2));
wdata_LL->plotOn(frame_LL,DataError(RooAbsData::SumW2));
RooFormulaVar accp_scaled_LL("ACC_scaled", "accp * 20", "@0 * 20", RooArgList(*ACC_LL));
accp_scaled_LL.plotOn(frame_LL,LineColor(8));
FitPdf_LL->plotOn(frame_LL, ProjWData(*conditionobs, *wdata_LL), LineStyle(kDashed),NumCPU(64, true));
The following plot:
the kDashed one is my PDF.
You can see that there is a big gap between PDF and data, but if you add a normalization, PDF and data look the same. Why is that?
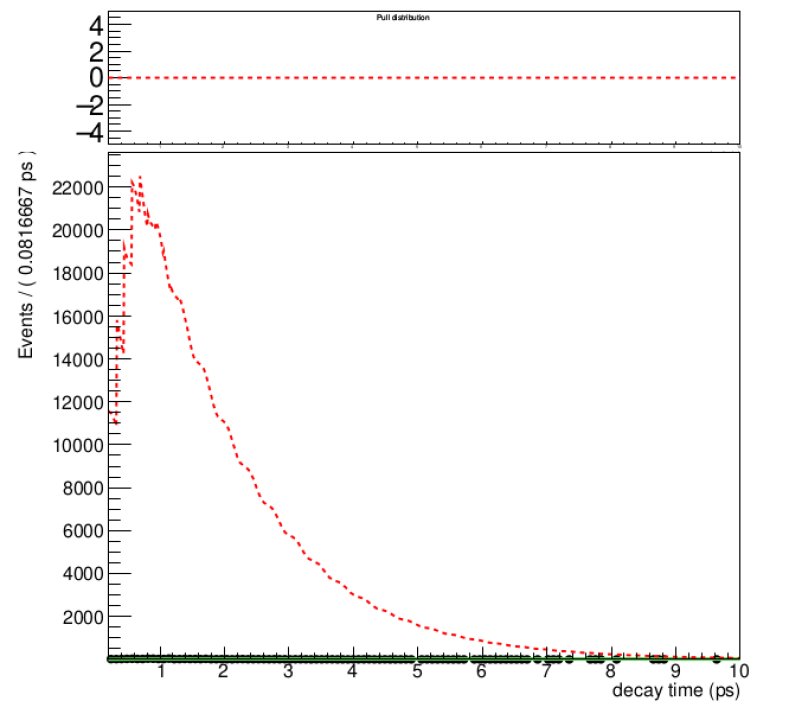
FitPdf_LL->plotOn(frame_LL, ProjWData(*conditionobs, *wdata_LL), LineStyle(kDashed),Normalization( 1, RooAbsReal::NumEvent),NumCPU(64, true));