Plot not drawing correctly


Please read tips for efficient and successful posting and posting code

_ROOT Version:6.24/08
_Platform:CentOS Linux(=lxplus)


ux release 7.9.2009
_Compiler:gcc version 4.8.5 20150623 (Red Hat 4.8.5-44) (GCC)?

Hello,
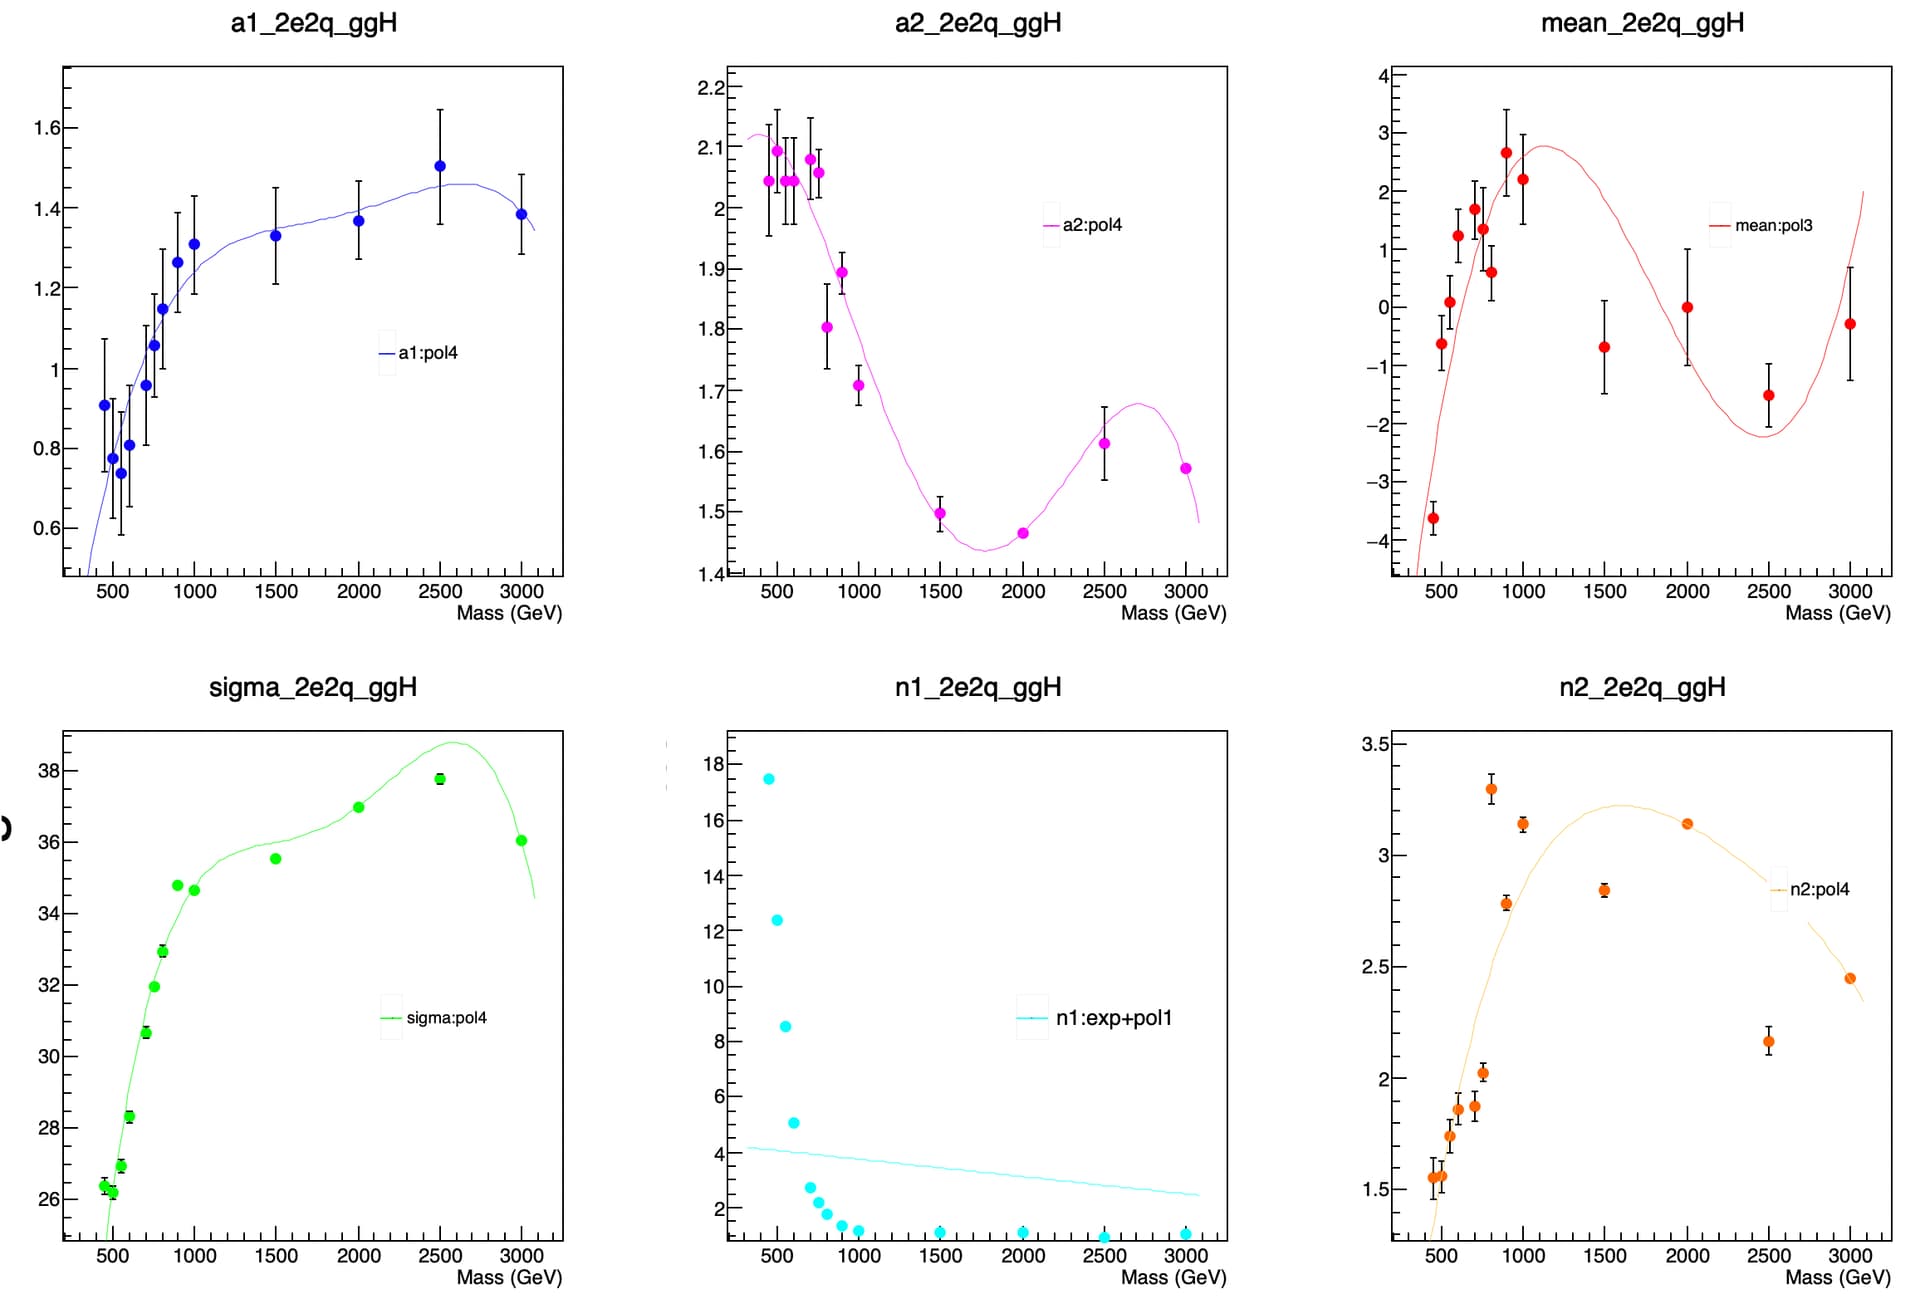
I want draw 6 plots of fit with data in one canvas. please, check the attache plots.
One plot(n1) does not draw correctly its fit result when I draw with other parameters but when I draw it in the separate canvas, it draw correctly.
For draw n1 correctly with other 5 parameter, I had to draw n1 first in separate canvas, and then 6 parameter later on. however this method does not work anymore.
Do you know why this happen?
Thank you in advance
__


DCB_ParFit_reDrawDCB_M300toM3000.C (15.9 KB)

When I run your macro after having turn back the 6 plots I get:

Let’s concentrate on the first plot (top left). It is done with:

C_DCB_2e2q_ggH->cd(1);
a1_2e2q_ggH->Fit("a1_PN","QERMVIN");
a1_2e2q_ggH->Draw("AP"); // Draw the TGraphErrrors
a1_PN->GetParameters(a1_PN_par);
a1_PN->SetParameters(a1_PN_par);
a1_2e2q_ggH->Fit("a1_PN","QERMVIN");
a1_PN->GetParameters(a1_PN_par);
a1_PN->SetParameters(a1_PN_par);
a1_2e2q_ggH->Fit("a1_PN","QERMVIN");
a1_PN->GetParameters(a1_PN_par);
a1_PN->SetParameters(a1_PN_par);
a1_PN->Draw("Same"); // Draw the funstion
lgd_FN_a1_2e2q_ggH->Draw(); // Draw the Legend

The 3 Draw() are what is displayed. I do not see anything wrong.

Hi, thank you for your prompt reply.
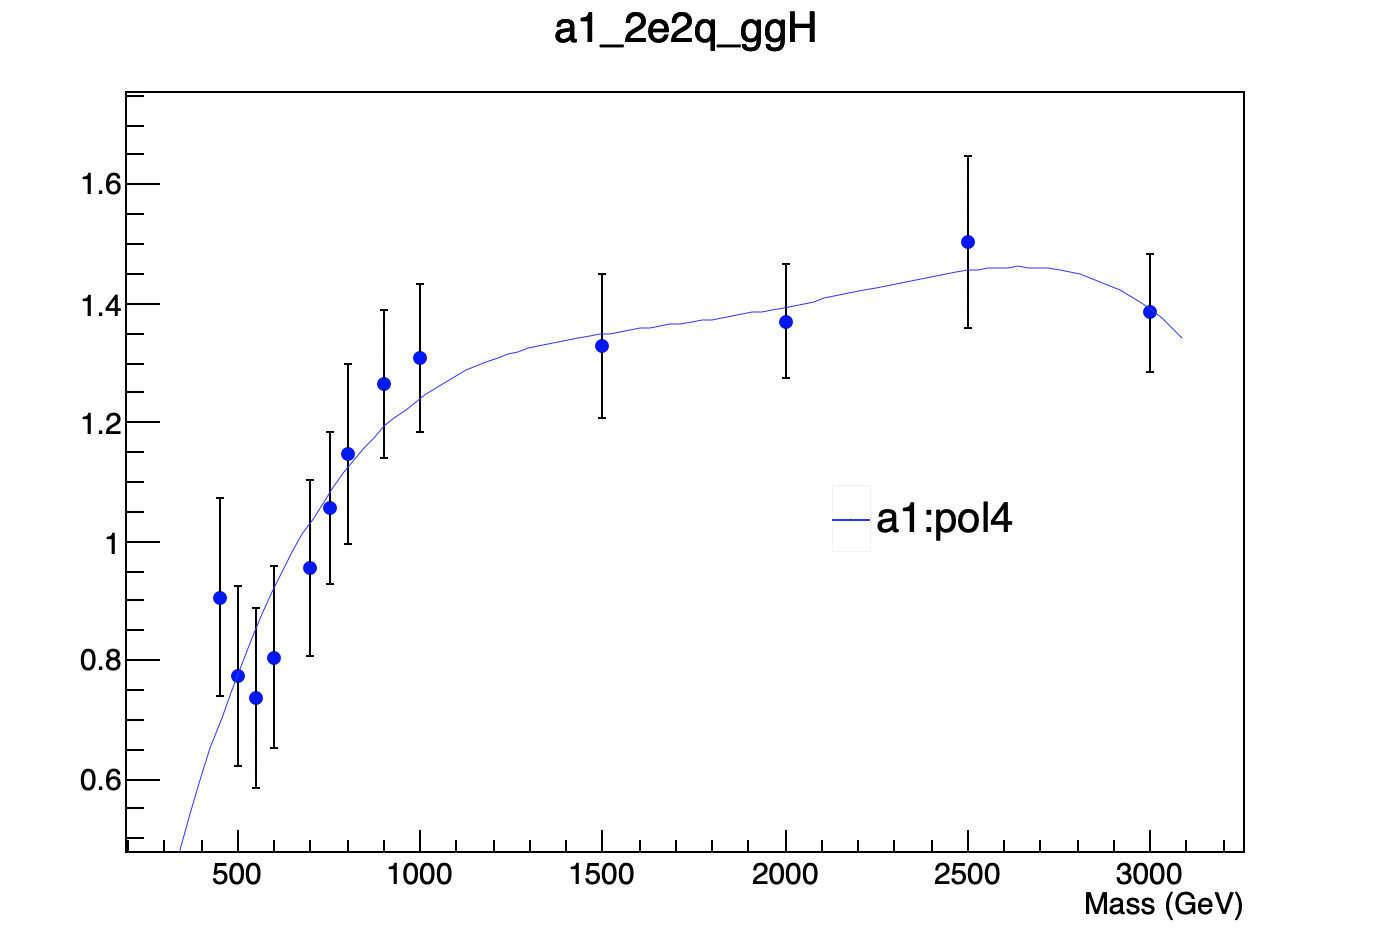
Yes, first, a1, parameters draw the fit fun. and data correctly.
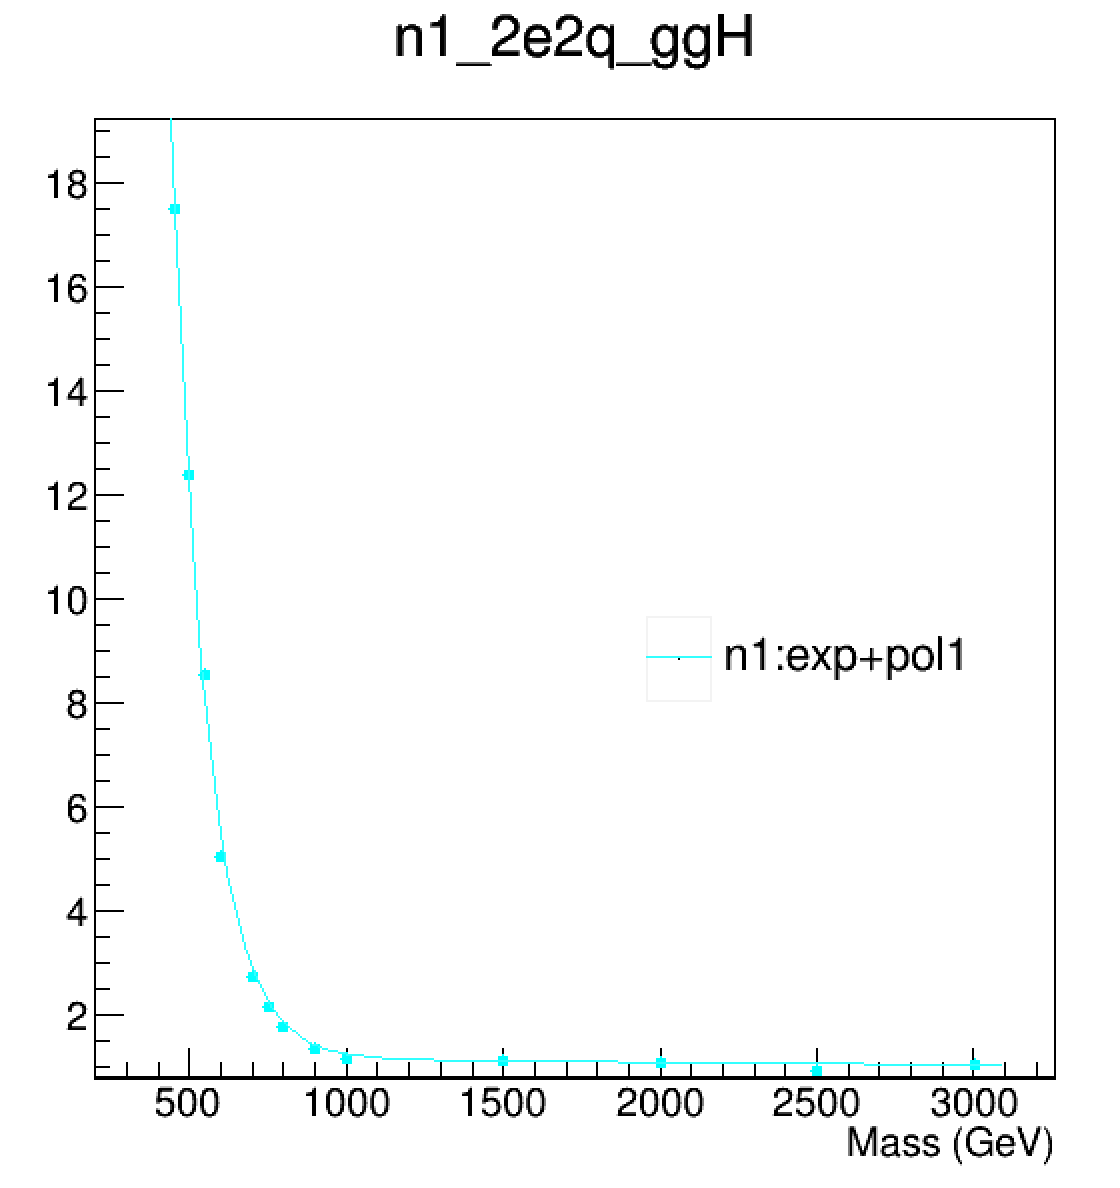
I am asking n1(sky color) parameter. The fit function does not match with the data but when I draw it separately, fit function and data match well. You can check n1 the result in a separate plot above.

If you use the same commands I extracted in a separated window you get the same plot of course:

auto c = new TCanvas();
a1_2e2q_ggH->Fit("a1_PN","QERMVIN");
a1_2e2q_ggH->Draw("AP");
a1_PN->GetParameters(a1_PN_par);
a1_PN->SetParameters(a1_PN_par);
a1_2e2q_ggH->Fit("a1_PN","QERMVIN");
a1_PN->GetParameters(a1_PN_par);
a1_PN->SetParameters(a1_PN_par);
a1_2e2q_ggH->Fit("a1_PN","QERMVIN");
a1_PN->GetParameters(a1_PN_par);
a1_PN->SetParameters(a1_PN_par);
a1_PN->Draw("Same");
lgd_FN_a1_2e2q_ggH->Draw();

Hello,
I think you did not understand my point.
Please, see the attached plot.
The left plot is the n1 parameter drawn onto the single canvas, and the right plot is when n1 is drawn into the divided canvas(3,2). why n1can not be drawn as left plot when I draw in a divided canvas with other parameters?

I found it. You have mistakes in the n2 part:

C_DCB_2e2q_ggH->cd(6);
//C_DCBall_2e2q_ggH->cd();
n2_2e2q_ggH->Draw("AP");
n2_PN->SetParameters(1,10);
n2_2e2q_ggH->Fit("n2_PN","QERMVIN");
n2_PN->GetParameters(n2_PN_par);
n2_PN->SetParameters(n2_PN_par);
n2_2e2q_ggH->Fit("n1_PN","QERMVIN"); // <<<<<<< should be n2_PN !
n2_PN->GetParameters(n2_PN_par);
n2_PN->SetParameters(n2_PN_par);
n2_2e2q_ggH->Fit("n1_PN","QERMVIN"); // <<<<<<< should be n2_PN !
n2_PN->GetParameters(n2_PN_par);
n2_PN->SetParameters(n2_PN_par);
n2_PN->Draw("Same");

Thank you.
It works correctly.

This topic was automatically closed 14 days after the last reply. New replies are no longer allowed.