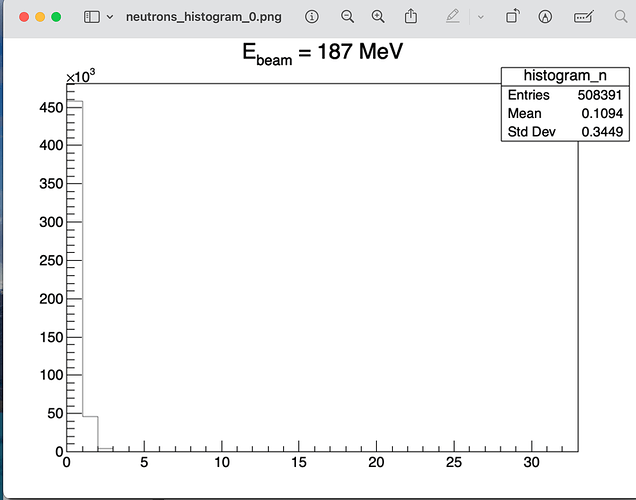
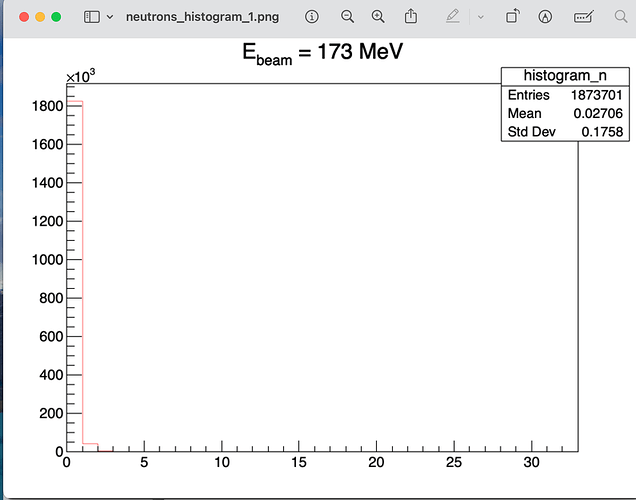
Plot multiple histograms with a loop for

Hello everybody. I’m a beginner with ROOT and I can’t do what my internship supervisor asks me. I have several root files each containing a tree. I perform a loop on these files in order to draw two different graphs (one for the neutrons and the other for the gammas) for each of these files and to trace them on two different canvases (one bringing together the histograms of the neutrons and the other that of gammas). But when I try the code below it returns two empty canvases, which doesn’t interest me. So I was wondering if you knew how to fix this problem.

// Liste des fichiers
std::vector files = {“RAW187OS_treeFF01.root”, “RAW173OS_treeFF01.root”, “RAW158OS_treeFF01.root”, “RAW148OS_treeFF01.root”};

// Liste des labels pour chaque histogramme
std::vector labels = {“E_{beam} = 187 MeV”, “E_{beam} = 173 MeV”, “E_{beam} = 158 MeV”, “E_{beam} = 148 MeV”};

//Création de 2 histogrammes un pour les neutrons et un pour les gammas
THStack *histogram_neutron = new THStack(“histogram_neutron”,“Os, for neutron;Number of detector;Number of event”);
THStack *histogram_gamma = new THStack(“histogram_gamma”,“Os, for gamma;Number of detector;Number of event”);

// Create a canvas to draw the histogram
TCanvas *canvas1 = new TCanvas(“canvas1”, “Canvas for neutrons histograms”, 800, 600);
TCanvas *canvas2 = new TCanvas(“canvas2”, “Canvas for gammas histograms”, 800, 600);

for (int k = 0; k <= 3 ; ++k) {
const auto& fileName = files[k];
const auto& labelName = labels[k];
TFile f{fileName};
std::unique_ptr tv__tree{f.Get(“Analysis_All”)};

//Création de l'histogramme
TH1F *histogram_n = new TH1F("histogram_n", labelName, 33, 0, 33);
TH1F *histogram_g = new TH1F("histogram_g", labelName, 33, 0, 33);

// Lier les variables de l'arbre aux variables locales
UShort_t Psd_All_Shift[34];
Double_t M_Tot[2];

// Définir les adresses des branches
tv__tree->SetBranchAddress("Psd_All_Shift", Psd_All_Shift);
tv__tree->SetBranchAddress("M_Tot", M_Tot);

// Définir les seuils de coupure pour Psd_All_Shift (première composante seulement)
UShort_t seuil_Psd_All_Shift_inf_n = 2550;
UShort_t seuil_Psd_All_Shift_sup_n = 6200;
UShort_t seuil_Psd_All_Shift_inf_g = 550;
UShort_t seuil_Psd_All_Shift_sup_g = 2550;
Double_t seuil_M_Tot_inf = 50;
Double_t seuil_M_Tot_sup = 127;

// Vecteur pour stocker le nombre d'événements dans l'encadrement pour chaque composante
std::vector<int> nb_evenements_par_detecteur_n(34, 0);
std::vector<int> nb_evenements_par_detecteur_g(34, 0);

// Boucle sur les événements pour compter les événements dans l'encadrement pour chaque composante de Psd_All_Shift
for (Long64_t i = 0; i < tv__tree->GetEntriesFast(); ++i) {
    tv__tree->GetEntry(i);
    int counter_n = 0, counter_g = 0;

    // Parcourir toutes les composantes de Psd_All_Shift
    for (int j = 0; j < 34; ++j) {
        UShort_t Psd_All_Shift_j = Psd_All_Shift[j];
        if (Psd_All_Shift_j > seuil_Psd_All_Shift_inf_n && Psd_All_Shift_j < seuil_Psd_All_Shift_sup_n && M_Tot[0] > seuil_M_Tot_inf && M_Tot[0] < seuil_M_Tot_sup && M_Tot[1] > seuil_M_Tot_inf && M_Tot[1] < seuil_M_Tot_sup) {
            ++counter_n;
        } else if (Psd_All_Shift_j > seuil_Psd_All_Shift_inf_g && Psd_All_Shift_j < seuil_Psd_All_Shift_sup_g && M_Tot[0] > seuil_M_Tot_inf && M_Tot[0] < seuil_M_Tot_sup && M_Tot[1] > seuil_M_Tot_inf && M_Tot[1] < seuil_M_Tot_sup) {
            ++counter_g;
        }
    }
    if (counter_n == 0) {
        nb_evenements_par_detecteur_n[0] = nb_evenements_par_detecteur_n[0] + 1;
    } else if (counter_n != 0) {
        nb_evenements_par_detecteur_n[counter_n] = nb_evenements_par_detecteur_n[counter_n] + 1;
    }
    histogram_n->Fill(counter_n);
    if (counter_g == 0) {
        nb_evenements_par_detecteur_g[0] = nb_evenements_par_detecteur_g[0] + 1;
    } else if (counter_g != 0) {
        nb_evenements_par_detecteur_g[counter_g] = nb_evenements_par_detecteur_g[counter_g] + 1;
    }
    histogram_g->Fill(counter_g);
}
histogram_neutron->Add(histogram_n);
histogram_neutron->Draw("nostack hist");
histogram_gamma->Add(histogram_g);
histogram_gamma->Draw("nostack hist");

}

// Add grid to the canva
canvas1->SetGrid();
canvas1->SetLogy();
canvas2->SetGrid();
canvas2->SetLogy();

// Draw the histogram
canvas1->BuildLegend();
canvas2->BuildLegend();

// Show the canvas
canvas1->Draw();
canvas2->Draw();
You need to tell ROOT on which canvas you want to draw each thing (THStack here), with mycanvas->cd();, e.g.:

histogram_neutron->Add(histogram_n);
canvas1->cd();
histogram_neutron->Draw("nostack hist");
histogram_gamma->Add(histogram_g);
canvas2->cd();
histogram_gamma->Draw("nostack hist");

Also, you don’t need these:

canvas1->Draw();
canvas2->Draw();

Thank you for your reply. I put these lines of code at the end of the loop but I still get nothing, the canvases are empty. I don’t understand why it doesn’t work.

Reduce your code to a minimum and start simple, see if you can draw one at least and debug from there. Are you really opening the files? reading the tree? filling the histograms?..

To check that the loop acts on the different trees, I asked it to return the content of the vectors where the neutrons and gammas are stored with this code for each tree

for (int j = 0; j < 34; ++j) {
        std::cout << "Neutron fission" << j << " : " << nb_evenements_par_detecteur_n[j] << std::endl;
        std::cout << "Gamma fission" << j << " : " << nb_evenements_par_detecteur_g[j] << std::endl;
}

This code proves me that the loop works. So the problem comes from the histograms directly.

And if I try for one tree only, I have the histogram for neutrons in the canva for neutrons and same for the histogram for gamma in the canva for gamma. So I don’t understand why this code doesn’t return the good thing.

With this lines

histogram_neutron->Add(histogram_n);
    canvas1->cd();
    histogram_neutron->Draw("nostack hist");
    canvas1->BuildLegend();
    canvas1->Update();
    histogram_gamma->Add(histogram_g);
    canvas2->cd();
    histogram_gamma->Draw("nostack hist");
    canvas2->BuildLegend();
    canvas2->Update();

I have on my canvases the last histogram for neutrons et for gamma (for the last tree) but not the previous ones.

I found the problem. In the loop, I ask to draw each histogram on the THStack (histogram_neutron->Draw(“nostack hist”)) but it does not keep this histogram in memory to add it one by one to the canvas. This is why it will display the last histogram on the canvas (and not the three previous ones). But I don’t see how to make the code superimpose the four histograms on the same canvas.

You cannot draw histograms to a THStack, you Add them to it and then draw the THStack. See the documentation.

Yes, I realized this by reading the documentation this morning but if I ask it to plot the THStack after the for loop is added the 4 histograms in the THStack, it returns me an empty canvas.

do you have a reproducer ?

Sorry but I don’t understand what is a reproducer.

a small C macro reproducing your problem.

std::vector<TString> files = {"RAW187OS_treeFF01.root", "RAW173OS_treeFF01.root", "RAW158OS_treeFF01.root", "RAW148OS_treeFF01.root"};

// Liste des labels pour chaque histogramme
std::vector<TString> labels = {"E_{beam} = 187 MeV", "E_{beam} = 173 MeV", "E_{beam} = 158 MeV", "E_{beam} = 148 MeV"};

//Création de 2 histogrammes un pour les neutrons et un pour les gammas
THStack *histogram_neutron = new THStack("histogram_neutron","Os, for neutron;Number of detector;Number of event");
THStack *histogram_gamma = new THStack("histogram_gamma","Os, for gamma;Number of detector;Number of event");

// Définir les seuils de coupure pour Psd_All_Shift (première composante seulement)
UShort_t seuil_Psd_All_Shift_inf_n = 2550, seuil_Psd_All_Shift_sup_n = 7000, seuil_Psd_All_Shift_inf_g = 550, seuil_Psd_All_Shift_sup_g = 2550;
Double_t seuil_M_Tot_inf = 50;
Double_t seuil_M_Tot_sup = 127;

for (int k = 0; k <= 1 ; ++k) {
    const auto& fileName = files[k];
    const auto& labelName = labels[k];
    TFile f{fileName};
    std::unique_ptr<TTree> tv__tree{f.Get<TTree>("Analysis_All")};

    //Création de l'histogramme Number of fission events detected depending to the number of pulse detected
    TH1F *histogram_n = new TH1F("histogram_n", labelName, 33, 0, 33);
    TH1F *histogram_g = new TH1F("histogram_g", labelName, 33, 0, 33);

    // Lier les variables de l'arbre aux variables locales
    UShort_t Psd_All_Shift[34];
    Double_t M_Tot[2];

    // Définir les adresses des branches
    tv__tree->SetBranchAddress("Psd_All_Shift", Psd_All_Shift);
    tv__tree->SetBranchAddress("M_Tot", M_Tot);

    // Vecteur pour stocker le nombre d'événements dans l'encadrement pour chaque composante
    std::vector<int> nb_evenements_par_detecteur_n(34, 0);
    std::vector<int> nb_evenements_par_detecteur_g(34, 0);

    // Boucle sur les événements pour compter les événements dans l'encadrement pour chaque composante de Psd_All_Shift
    for (Long64_t i = 0; i < tv__tree->GetEntriesFast(); ++i) {
        tv__tree->GetEntry(i);
        int counter_n = 0, counter_g = 0;

        // Parcourir toutes les composantes de Psd_All_Shift
        for (int j = 0; j < 34; ++j) {
            UShort_t Psd_All_Shift_j = Psd_All_Shift[j];
            if (Psd_All_Shift_j > seuil_Psd_All_Shift_inf_n && Psd_All_Shift_j < seuil_Psd_All_Shift_sup_n && M_Tot[0] > seuil_M_Tot_inf && M_Tot[0] < seuil_M_Tot_sup && M_Tot[1] > seuil_M_Tot_inf && M_Tot[1] < seuil_M_Tot_sup) {
                ++counter_n;
            } else if (Psd_All_Shift_j > seuil_Psd_All_Shift_inf_g && Psd_All_Shift_j < seuil_Psd_All_Shift_sup_g && M_Tot[0] > seuil_M_Tot_inf && M_Tot[0] < seuil_M_Tot_sup && M_Tot[1] > seuil_M_Tot_inf && M_Tot[1] < seuil_M_Tot_sup) {
                ++counter_g;
            }
        }
        if (counter_n == 0) {
            nb_evenements_par_detecteur_n[0] = nb_evenements_par_detecteur_n[0] + 1;
        } else if (counter_n != 0) {
            nb_evenements_par_detecteur_n[counter_n] = nb_evenements_par_detecteur_n[counter_n] + 1;
        }
        histogram_n->Fill(counter_n);
        if (counter_g == 0) {
            nb_evenements_par_detecteur_g[0] = nb_evenements_par_detecteur_g[0] + 1;
        } else if (counter_g != 0) {
            nb_evenements_par_detecteur_g[counter_g] = nb_evenements_par_detecteur_g[counter_g] + 1;
        }
        histogram_g->Fill(counter_g);
    }
    for (int j = 0; j < 34; ++j) {
        std::cout << "Neutron fission" << j << " : " << nb_evenements_par_detecteur_n[j] << std::endl;
        std::cout << "Gamma fission" << j << " : " << nb_evenements_par_detecteur_g[j] << std::endl;
    }
    histogram_n->SetLineColor(k + 1);
    histogram_g->SetLineColor(k + 1);
    histogram_neutron->Add(histogram_n);
    histogram_gamma->Add(histogram_g);
}

// Create a canvas to draw the histogram
TCanvas *canvas1 = new TCanvas("canvas1", "Canvas for neutrons histograms", 800, 600);
TCanvas *canvas2 = new TCanvas("canvas2", "Canvas for gammas histograms", 800, 600);

// Dessiner les histogrammes pour les neutrons
canvas1->cd();
histogram_neutron->Draw("nostack hist");
canvas1->SetGrid();
canvas1->SetLogy();
canvas1->BuildLegend();
canvas1->SetGrid();
canvas1->SetLogy();
canvas1->Update();
canvas1->SaveAs("neutrons_histogram.png");

// Dessiner les histogrammes pour les gammas
canvas2->cd();
histogram_gamma->Draw("nostack hist");
canvas2->SetGrid();
canvas2->SetLogy();
canvas2->BuildLegend();
canvas2->SetGrid();
canvas2->SetLogy();
canvas2->Update();
canvas2->SaveAs("gammas_histogram.png");

Thank you for the code. Just looking quickly at it I do not see anything wrong. We cannot run it as we do not have the root files.

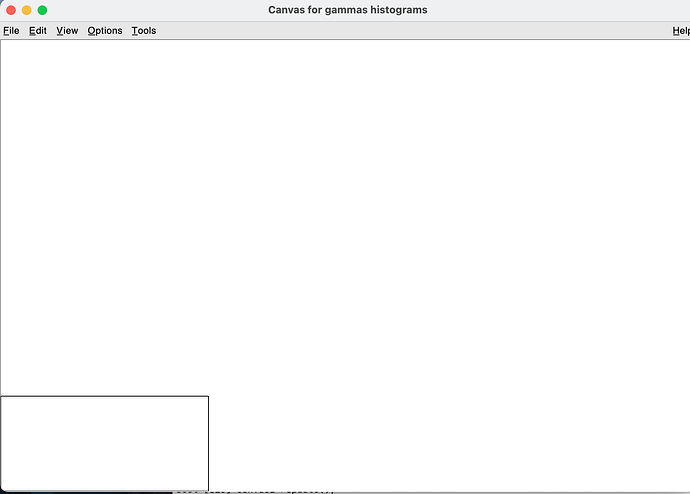
Thank you for your reply. I don’t understand either because the code returns two empty canvases. For ROOT files, I cannot send them because they weigh 10 GB in total. The code returns me this canvas for exemple.

Ok, I kpt the structure of you macro. I only replaced the histogram creation part by 2 fake histograms. And it is working:

void flo_flo() {
   //Création de 2 histogrammes un pour les neutrons et un pour les gammas
   THStack *histogram_neutron = new THStack("histogram_neutron","Os, for neutron;Number of detector;Number of event");
   THStack *histogram_gamma = new THStack("histogram_gamma","Os, for gamma;Number of detector;Number of event");

   TH1F *h1 = new TH1F("h1","h1",10,-3,3);
   h1->FillRandom("gaus",10000);
   TH1F *h2 = new TH1F("h2","h2",10,-3,3);
   h2->FillRandom("gaus",10000);

   histogram_neutron->Add(h1);
   histogram_neutron->Add(h2);
   histogram_gamma->Add(h1);
   histogram_gamma->Add(h2);


   // Create a canvas to draw the histogram
   TCanvas *canvas1 = new TCanvas("canvas1", "Canvas for neutrons histograms", 800, 600);
   TCanvas *canvas2 = new TCanvas("canvas2", "Canvas for gammas histograms", 800, 600);

   // Dessiner les histogrammes pour les neutrons
   canvas1->cd();
   histogram_neutron->Draw("nostack hist");
   canvas1->SetGrid();
   canvas1->SetLogy();
   canvas1->BuildLegend();
   canvas1->SetGrid();
   canvas1->SetLogy();
   canvas1->Update();
   canvas1->SaveAs("neutrons_histogram.png");

   // Dessiner les histogrammes pour les gammas
   canvas2->cd();
   histogram_gamma->Draw("nostack hist");
   canvas2->SetGrid();
   canvas2->SetLogy();
   canvas2->BuildLegend();
   canvas2->SetGrid();
   canvas2->SetLogy();
   canvas2->Update();
   canvas2->SaveAs("gammas_histogram.png");
}

May be your histograms are empty ?

I verified that the code plots each histogram by plotting them in a canvas and they are not empty


Does the code I sent you works for you ?

Yes, it works.

Ok … let me try to simulate your loop

Ok, I made this:

void flo_flo() {
   //Création de 2 histogrammes un pour les neutrons et un pour les gammas
   THStack *histogram_neutron = new THStack("histogram_neutron","Os, for neutron;Number of detector;Number of event");
   THStack *histogram_gamma = new THStack("histogram_gamma","Os, for gamma;Number of detector;Number of event");

   for (int k = 0; k <= 1 ; ++k) {
      TH1F *histogram_n = new TH1F(Form("histogram_n_%d",k),Form("histogram_n_%d",k),10,-3,3);
      histogram_n->FillRandom("gaus",10000);
      TH1F *histogram_g = new TH1F(Form("histogram_g_%d",k),Form("histogram_g_%d",k),10,-3,3);
      histogram_g->FillRandom("gaus",10000);
      
      histogram_n->SetLineColor(k + 1);
      histogram_g->SetLineColor(k + 1);
      histogram_neutron->Add(histogram_n);
      histogram_gamma->Add(histogram_g);
   }

   // Create a canvas to draw the histogram
   TCanvas *canvas1 = new TCanvas("canvas1", "Canvas for neutrons histograms", 800, 600);
   TCanvas *canvas2 = new TCanvas("canvas2", "Canvas for gammas histograms", 800, 600);

   // Dessiner les histogrammes pour les neutrons
   canvas1->cd();
   histogram_neutron->Draw("nostack hist");
   canvas1->SetGrid();
   canvas1->SetLogy();
   canvas1->BuildLegend();
   canvas1->SetGrid();
   canvas1->SetLogy();
   canvas1->Update();
   canvas1->SaveAs("neutrons_histogram.png");

   // Dessiner les histogrammes pour les gammas
   canvas2->cd();
   histogram_gamma->Draw("nostack hist");
   canvas2->SetGrid();
   canvas2->SetLogy();
   canvas2->BuildLegend();
   canvas2->SetGrid();
   canvas2->SetLogy();
   canvas2->Update();
   canvas2->SaveAs("gammas_histogram.png");
}

still ok for me.
Can you try ?
It is quite close to you original macro.