Hello guys, I started to use root to plot data.
I have a data3.txt file that is formatted in this way.
t1,x1,y1,z1
t2,x2,y2,z2
…
tn,xn,yn,zn
0,-3.995401863840999e-10,0,-3.995401905274687e-10
9.999999999999999e-12,4.997762014691721e-10,9.999999999999999e-12,4.995327580028662e-10
2e-11,3.637950016230157e-09,2e-11,3.637187318331949e-09
3e-11,8.978101986779303e-09,3e-11,8.976621362139576e-09
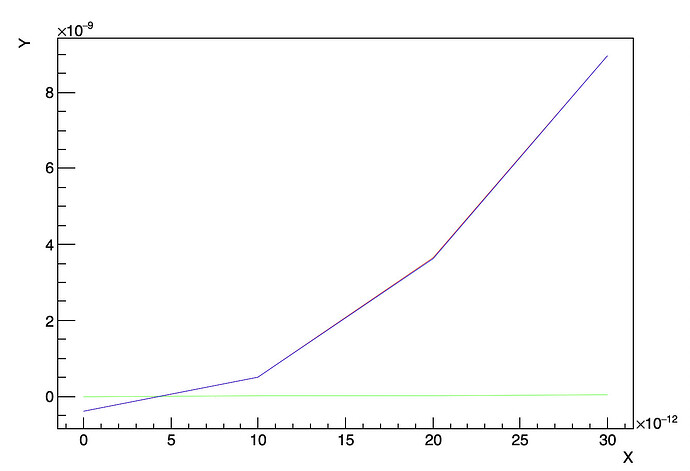
I implemented this code, pop up the windows, but i don’t see the graph. should be three signal in the same graph. Where do i wrong?
void plot2(){
ifstream infile; // input file handle
infile.open(“data3.txt”); // opening input data filedouble x,y,z,w; // variable for storing data points while reading
vector x_list, y_list, z_list, w_list; // vectors for storing data points x and ywhile (infile>>x>>y>>z>>w) { // reading data point in while loop
x_list.push_back(x); // adding data point x to vector
y_list.push_back(y); // adding data point y to vectorz_list.push_back(z); // adding data point z to vector w_list.push_back(w); // adding data point w to vector}
TMultiGraph *mg = new TMultiGraph(); // declaring TMultiGraph pointer
TGraph *g1 = new TGraph(x_list.size(), &x_list[0], &y_list[0]); // creating TGraph for first and second columns
TGraph *g2 = new TGraph(x_list.size(), &x_list[0], &z_list[0]); // creating TGraph for first and third columns
TGraph *g3 = new TGraph(x_list.size(), &x_list[0], &w_list[0]); // creating TGraph for first and fourth columnsg1->SetLineColor(kRed); // set color for first graph
g2->SetLineColor(kGreen); // set color for second graph
g3->SetLineColor(kBlue); // set color for third graphmg->Add(g1);
mg->Add(g2);
mg->Add(g3);mg->Draw(“AL”);
mg->GetXaxis()->SetTitle(“X”);
mg->GetYaxis()->SetTitle(“Y”);
mg->SetTitle(“Plot of Second, Third, and Fourth Columns vs First Column”);
}


