Plot multi lines by using "TF1" function

Dear experts,

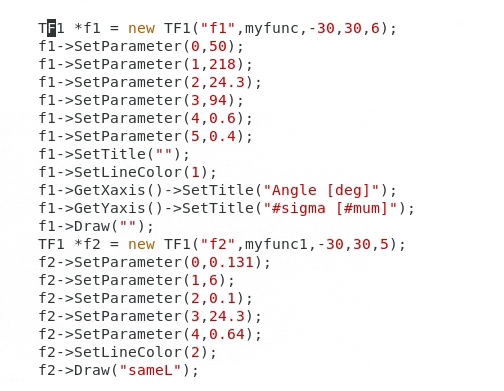
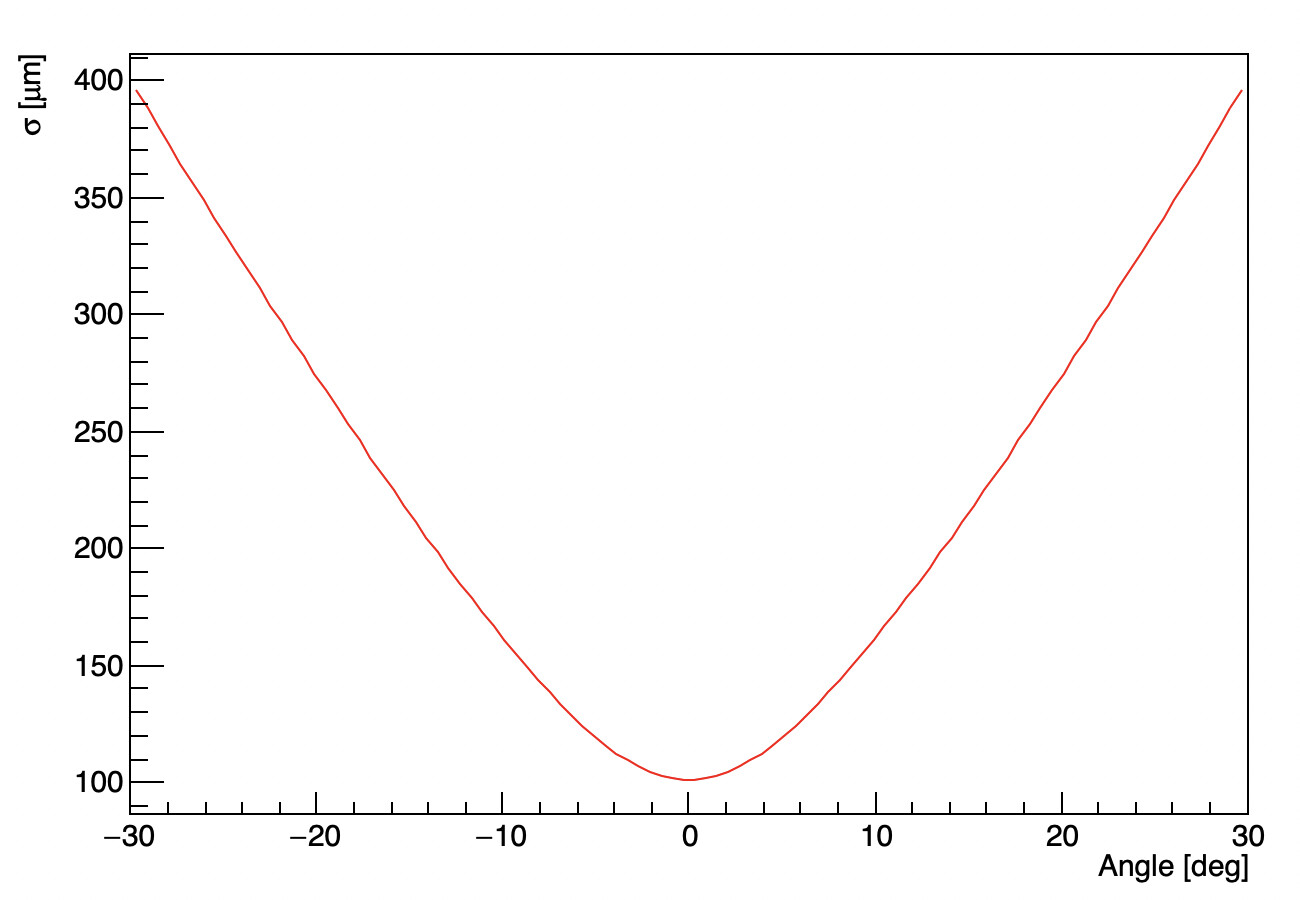
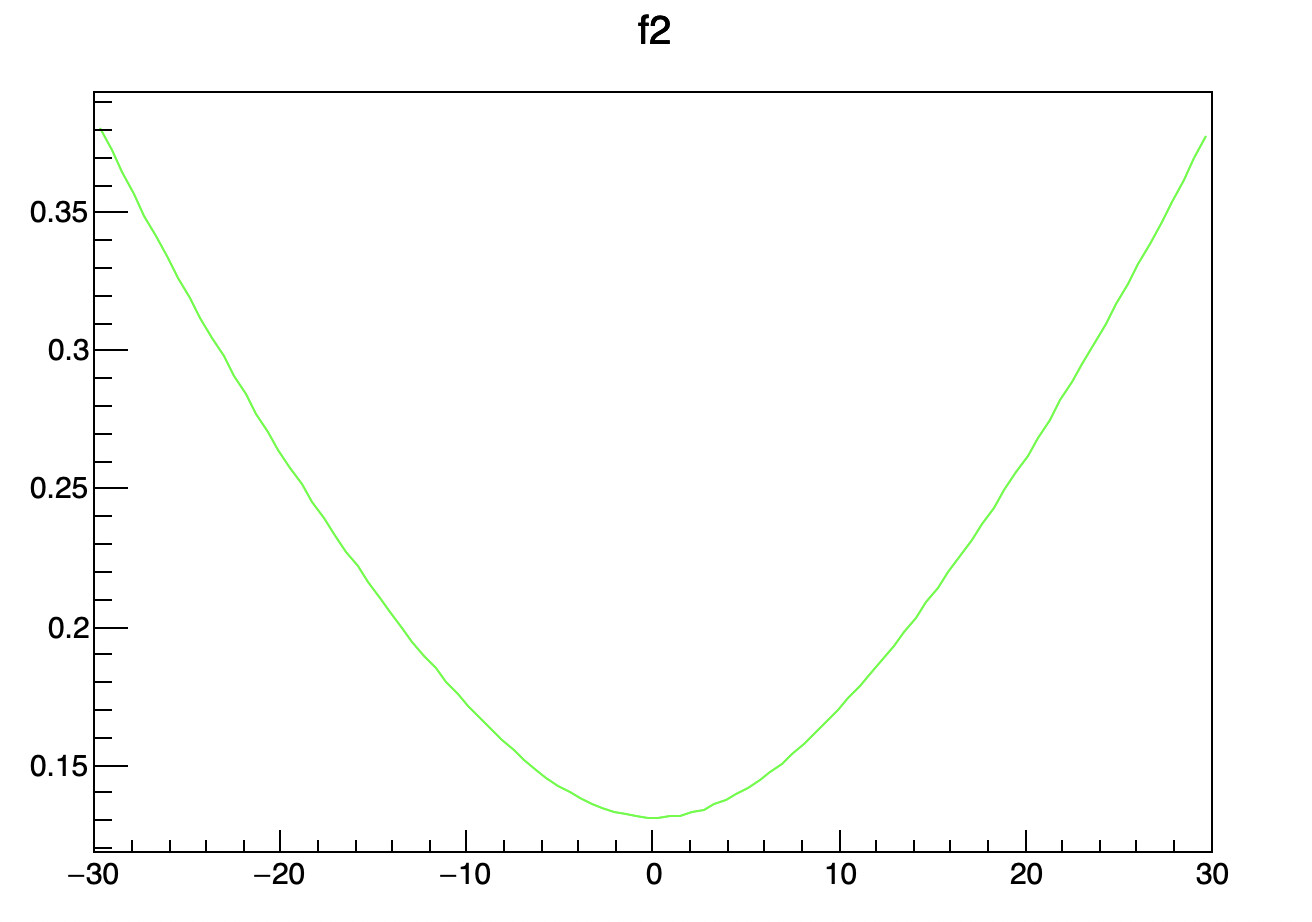
I found the result only shows the first line while write the script as attachment shows. Whatever I changed the relative position of “f1->Draw()” or “f2->Draw(“same”)” or exchanged, the plot only shows one line. I try to define “TCanvas * c” but also failed.
Could you please give me some suggestions?
Thanks very much for your help.

Best regards,
Jiechen

plot

Instead of a screen copy can you send a script we can run? Thanks in advance.

1 Like

posrebs.C (1.3 KB)
Dear experts,
I upload the script, see attachment.

Best regards,
Jiechen

The reason why you see only one plot is clear. Your first function plot is:

The second is:

Look at the Y axis of the 2nd plot. It is outside the Y range of the first one (which impose the Y scale).

Dear experts,

Thanks for your help, I didn’t notice these two different units of Y-axis.
O(∩_∩)O.

Best regards,
Jiechen

1 Like

This topic was automatically closed 14 days after the last reply. New replies are no longer allowed.