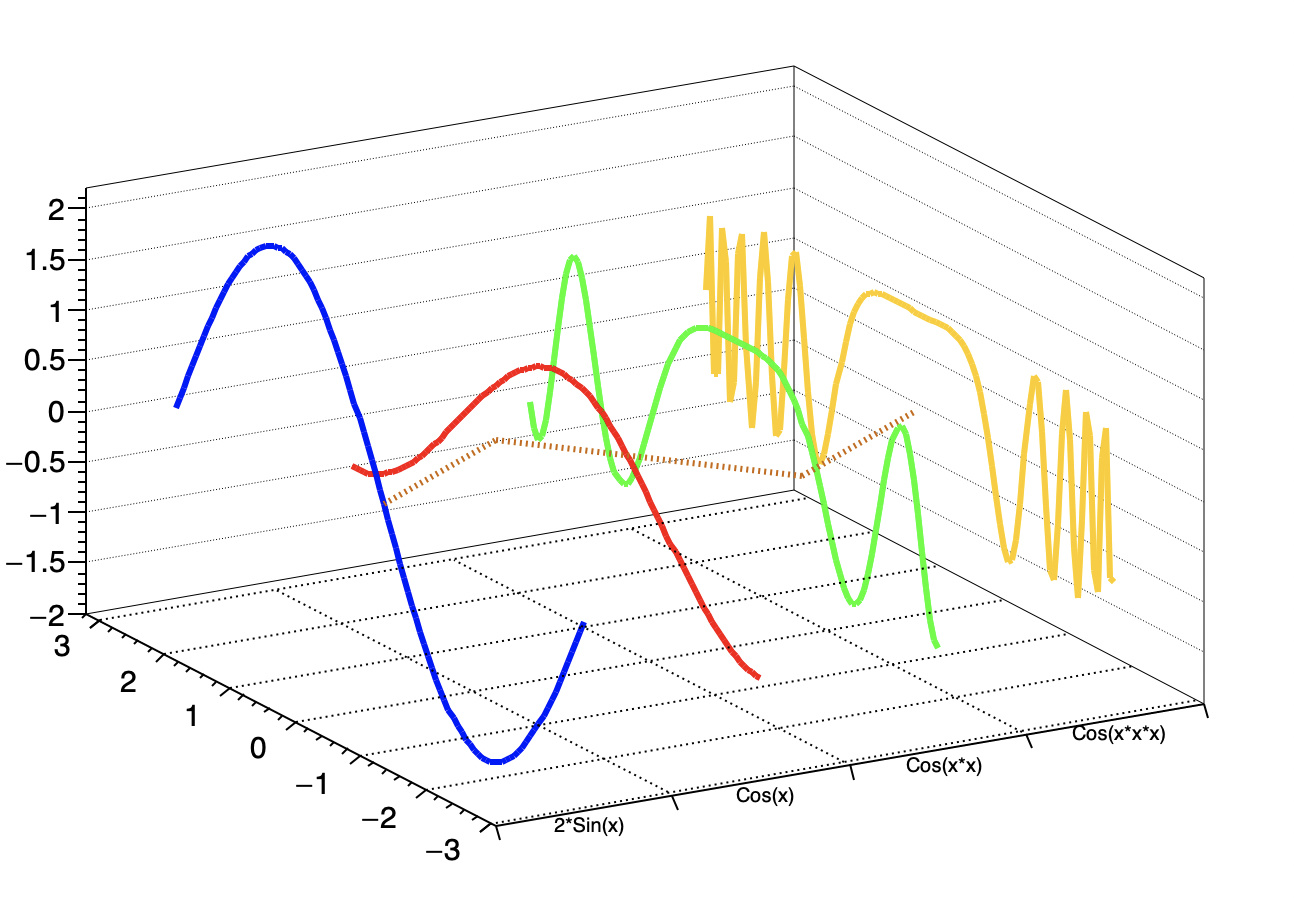
There is not setting to have the grid on a 3D plot like that.
But it can be easily drawn with 3D lines too.
void multigraph3D()
{
   auto C = new TCanvas("C","C",200,10,700,500);

   auto mg = new TMultiGraph();

   auto gr1 = new TGraph(); gr1->SetLineColor(kBlue);
   auto gr2 = new TGraph(); gr2->SetLineColor(kRed);
   auto gr3 = new TGraph(); gr3->SetLineColor(kGreen);
   auto gr4 = new TGraph(); gr4->SetLineColor(kOrange);

   Double_t dx = 6.28/100;
   Double_t x  = -3.14;

   for (int i=0; i<=100; i++) {
      x = x+dx;
      gr1->SetPoint(i,x,2.*TMath::Sin(x));
      gr2->SetPoint(i,x,TMath::Cos(x));
      gr3->SetPoint(i,x,TMath::Cos(x*x));
      gr4->SetPoint(i,x,TMath::Cos(x*x*x));
   }

   mg->Add(gr4); gr4->SetTitle("Cos(x*x*x)"); gr4->SetLineWidth(3);
   mg->Add(gr3); gr3->SetTitle("Cos(x*x)")  ; gr3->SetLineWidth(3);
   mg->Add(gr2); gr2->SetTitle("Cos(x)")    ; gr2->SetLineWidth(3);
   mg->Add(gr1); gr1->SetTitle("2*Sin(x)")  ; gr1->SetLineWidth(3);

   mg->Draw("a fb l3d");
   double xl[4] = {0.5,1.5,2.5,3.5};
   double yl[4] = {0.,1,-1,0};
   double zl[4] = {0.,0.,0.,0.};
   auto *pl3 = new TPolyLine3D(4, xl, yl, zl);
   pl3->SetLineColor(kOrange+2);
   pl3->SetLineWidth(3);
   pl3->SetLineStyle(3);

   pl3->Draw();

   // Draw grid
   for (double yg=-3; yg<=3; yg++) {
      auto *lg3 = new TPolyLine3D(2);
      lg3->SetLineStyle(3);
      lg3->SetPoint(0,0,yg,-2);
      lg3->SetPoint(1,4,yg,-2);
      lg3->Draw();
   }
  for (double xg=1; xg<=3; xg++) {
      auto *lg3 = new TPolyLine3D(2);
      lg3->SetLineStyle(3);
      lg3->SetPoint(0,xg,-3,-2);
      lg3->SetPoint(1,xg,3,-2);
      lg3->Draw();
   }
}