hello experts
im trying to plot a histgram pair_pt with weight totWeight in tree tnpEleTrig/fitter_tree, read from root file newfile_400to650_test.root and save new hist to hist.root
the code is here:
import  ROOT
inFile = ROOT.TFile.Open("newfile_400to650_test.root","READ")
tree = inFile.Get("tnpEleTrig/fitter_tree")
m= ROOT.TH1D ("pair_pt_withWeight","pair_pt_withWeight",150,0,1000)
for   entryNum  in range (0,tree.GetEntries()):
   pt = getattr(tree,"pair_pt")
   weight= getattr(tree,"totWeight")
   m.Fill(pt,weight)
m.SetDirectory(0)
m.Draw()
inFile.Close()
outHistFile=ROOT.TFile.Open("hist.root","RECREATE")
outHistFile.cd()
m.Write()
outHistFile.Close()
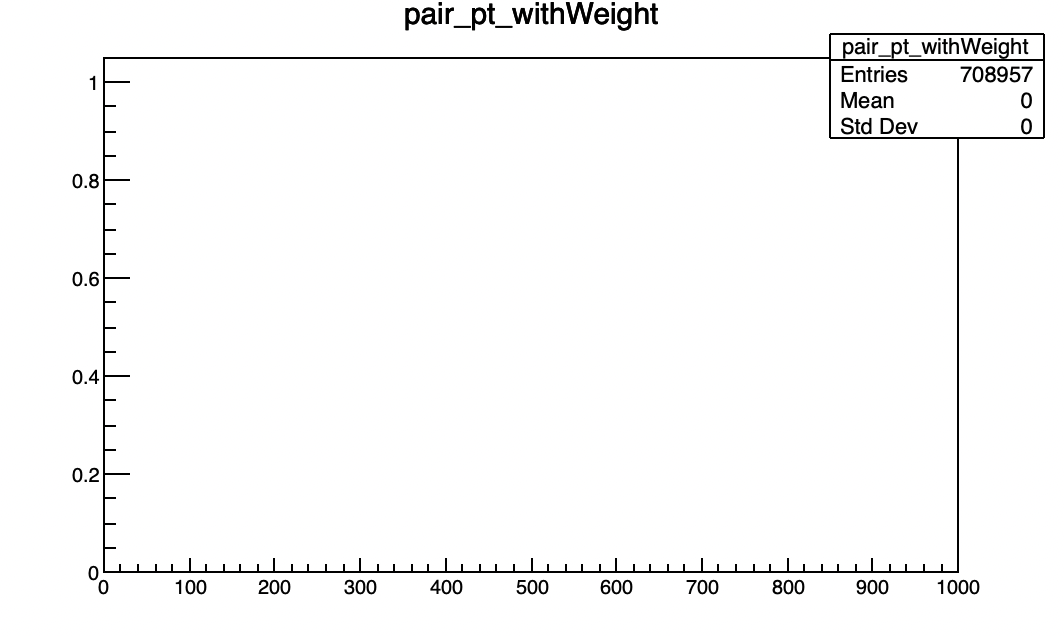
and i checked the output file, the histogram is empty, I’m not sure what’s the reason?
If the plot you show is the one produced by m.Draw() in your script, it looks like your histogram is empty even before saving it in hist.root. In that case can you check (via a print-out) what the values of pt and weight are ?
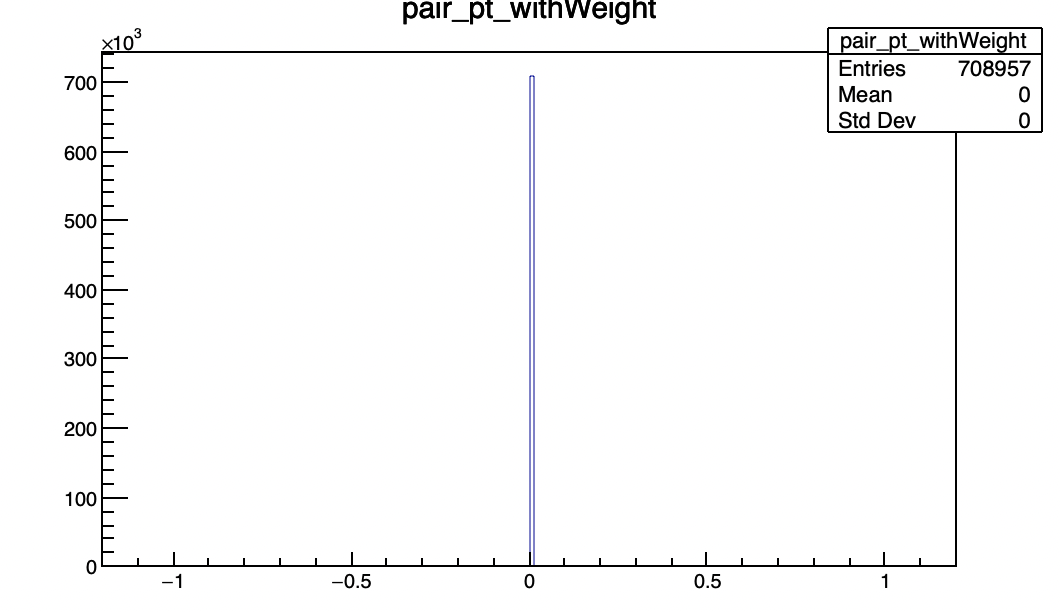
From the statistics box, there are many entries in the histogram, but they are not “visible”; that probably means they are outside the range of the histogram’s x-axis range. You can add this line
ROOT.gStyle.SetOptStat(111111)
(that’s 6 ones) before drawing, or at the beginning of the macro, to see the number of entries in underflow and overflow. Adjust the histogram axis accordingly when you create it. If you don’t know what limits to use you can just draw “pair_pt” directly from the tree (tree.Draw("pair_pt")) and see.
i tried to add lines to print:
for entryNum in range (0,tree.GetEntries()):
pt = getattr(tree,“pair_pt”)
weight= getattr(tree,“totWeight”)
pt.Print()
weight.Print()
m.Fill(pt,weight)
and got error AttributeError: 'float' object has no attribute 'Print'…