Hello, I am trying to plot several boxes over a histogram in a single canvas and pad. When I draw the boxes and histogram and save the canvas, only the boxes that I drew appear but not the histogram. The boxes are set to be fully transparent and I used the ->Draw(“same”) option on the boxes so they should all be plotting to the same canvas as the histogram but the histogram is not being drawn.
Here is the code I had written below:
//Initialize mcChain to hold tree variables
  TChain *mcChain = new TChain("RecTree");

  mcChain->Add("~/work2/DCVcuts/MCfiles/RUN82_KLpipipi0_g2ana_KinCuts_NoVeto.root");

  //Created canvas for histogram
  TCanvas *c1 = new TCanvas("c1", "c1", 550, 450);

  // settings drawing the regions on the 2D Pt vs Rec Z histogram.
  double Xi[8]={1500,2900,2900,3000,2900,5100,5100,5100};
  double Xe[8]={2900,5100,5100,5000,5100,6500,6500,6500};
  double Yi[8]={0,260,120,130,0,260,120,0};
  double Ye[8]={500,500,260,250,120,500,260,120};

  TBox* box0 = new TBox(Xi[0],Yi[0],Xe[5],Ye[5]);
  TBox* box1 = new TBox(Xi[4],Yi[4],Xe[1],Ye[1]);
  TBox* box2 = new TBox(Xi[2],Yi[2],Xe[6],Ye[6]);
  TBox* box3 = new TBox(Xi[3],Yi[3],Xe[3],Ye[3]);

  // Set style of boxes//
  box0->SetFillColorAlpha(0, 0.);
  box0->SetFillStyle(0);
  box0->SetLineWidth(2);
  box0->SetLineColor(1);
  box1->SetFillColorAlpha(0, 0.);
  box1->SetFillStyle(0);
  box1->SetLineWidth(2);
  box1->SetLineColor(1);
  box2->SetFillColorAlpha(0, 0.);
  box2->SetFillStyle(0);
  box2->SetLineWidth(2);
  box2->SetLineColor(1);
  box3->SetFillColorAlpha(0, 0.);
  box3->SetFillStyle(0);
  box3->SetLineWidth(3);
  box3->SetLineColor(1);

  //Initialized histogram
  TH2F *Pi0PtvsPi0RecZ = new TH2F("#pi^{0} P_{t} vs #pi^{0} Z_{vtx}", "#pi^{0} P_{t} vs #pi^{0} Z_{vtx}", 60, 1500, 6000, 60, 0, 500);

  //Draw data of mcChain into histogram with no cuts
  mcChain->Draw("Pi0Pt:Pi0RecZ >> Pi0PtvsPi0RecZ");

  //Apply style to histogram with no cuts
  Pi0PtvsPi0RecZ->Draw("COLZ");

  box0->Draw("same");
  box1->Draw("same");
  box2->Draw("same");
  box3->Draw("same");

  gStyle->SetOptStat(0);

  //Save histogram in the following directory
  c1->SaveAs("/home/had/jusa/work2/DCVcuts/plots/Pi0Pt_vs_Pi0RecZ_KinCuts_NoVeto.pdf");

  delete mcChain;
  delete Pi0PtvsPi0RecZ;
  delete box0;
  delete box1;
  delete box2;
  delete box3;
  delete c1;

  return 0;
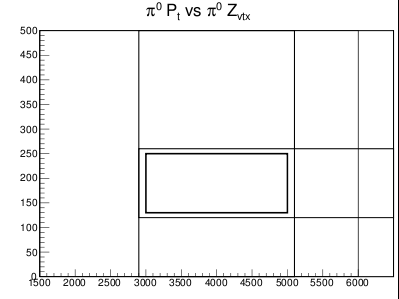
And below is the output of the graph: