Plot angular probability - polar histogram

Hi everybody!

I’m not 100% sure about how to call what I need.

I have these two coloumns: the first one is a list of angular boundaries, the second one is the radius of each of these angular sectors/bins.

|theta||probability|
|180.00||0.00000E+00|
|90.00||1.93071E-03|
|60.00||8.34649E-03|
|30.00||3.30873E-02|
|15.00||6.31371E-02|
|10.00||6.93081E-02|
|5.00||2.21926E-01|
|4.00||9.57030E-02|
|3.00||1.25615E-01|
|2.00||1.55263E-01|
|1.00||1.61721E-01|
|0.00||6.39622E-02|

What I want is to produce a picture like this sketch I drew:

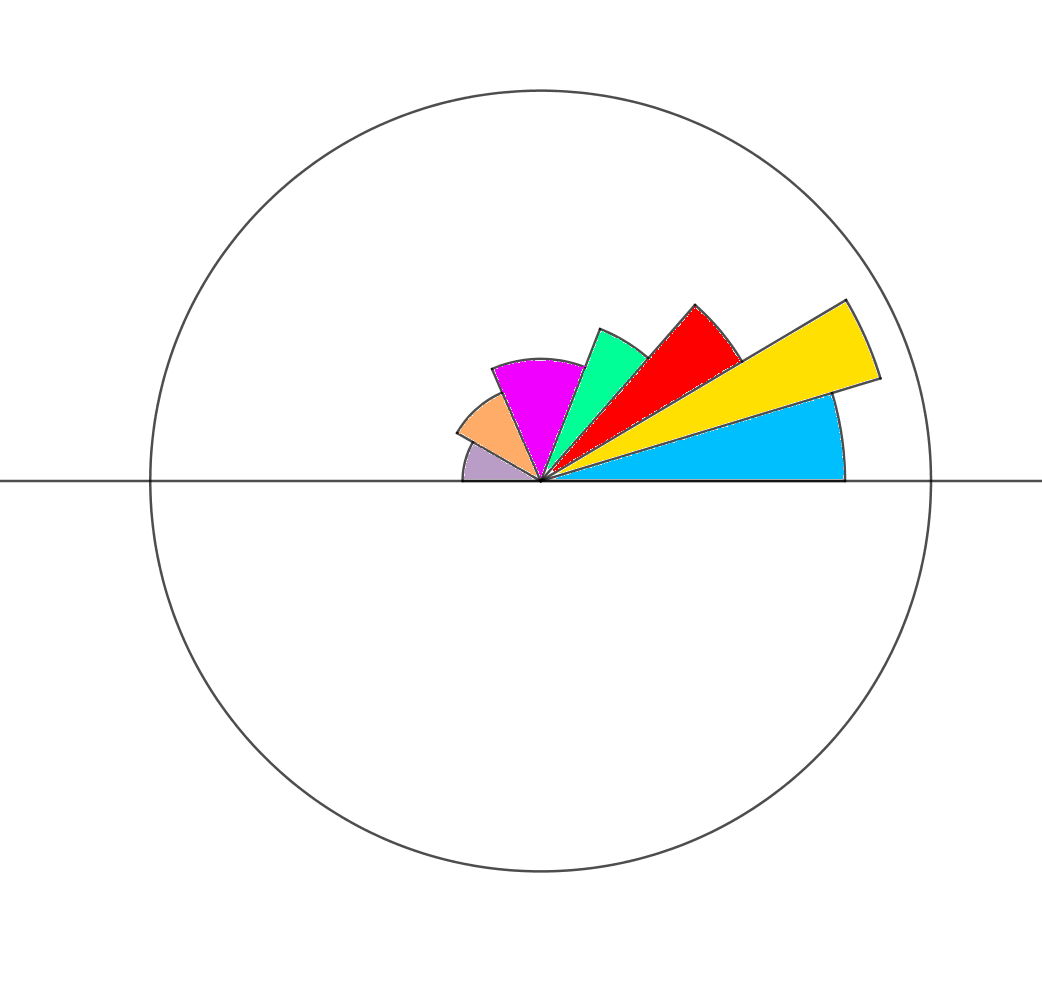
In this example, the first angular sector (the one in blue) should go from 0° to 1° counter-clockwise starting from the x-axis, and its radius should be 6.39622E-02 (the circumference has radius 1).
The next sector, in yellow, should go from 1° to 2° and it’s radius should be 1.61721E-01.
So on till the last angular sector that should go from 90° to 180* with a radius of 1.93071E-03.

The closest thing I got is this TGraphPolar:


It’s pretty close to what I need, but the edges of the sectors are not circumference arcs…

I really don’t know how to get what I need.
There’s no THistPolar class as far as I know.

This was the closest I managed to get:

void polgr() {
  // theta bin borders:
  std::array<double, 12> thetaBinBorders
    = {0., 1., 2., 3., 4., 5., 10., 15., 30., 60., 90., 180.};
  std::array<double, 11> prob
    = {6.39622E-02, 1.61721E-01, 1.55263E-01, 1.25615E-01, 9.57030E-02, 2.21926E-01, 6.93081E-02, 6.31371E-02, 3.30873E-02, 8.34649E-03, 1.93071E-03};

  // The bins are bin borders; the TGraph wants bin centers with "uncertainties". Convert!
  // O, and convert deg to rad:

  std::array<double, 11> thetaBinCenters;
  std::array<double, 11> thetaBinErrors;
  double degToRad = TMath::Pi()/180.;
  for (std::size_t i = 0; i < thetaBinCenters.size(); ++i) {
    thetaBinErrors[i] = (thetaBinBorders[i + 1] - thetaBinBorders[i]) / 2.;
    thetaBinCenters[i] = thetaBinBorders[i] + thetaBinErrors[i];
    std::cout << thetaBinCenters[i] << " " << thetaBinErrors[i] << '\n';
    thetaBinErrors[i] *= degToRad;
    thetaBinCenters[i] *= degToRad;
  }
  
  TGraphPolar *pg
    = new TGraphPolar(thetaBinCenters.size(), thetaBinCenters.data(),
		      prob.data(), thetaBinErrors.data());
  pg->SetFillColor(kRed);
  pg->SetLineColor(2);
  pg->SetLineWidth(6);
  pg->Draw("E");
  gPad->Update(); // creates GetPolarGram()
  pg->GetPolargram()->SetToRadian();
}

Maybe @couet will have a better idea when he’s back in two weeks!

1 Like

Mostly… :thinking:

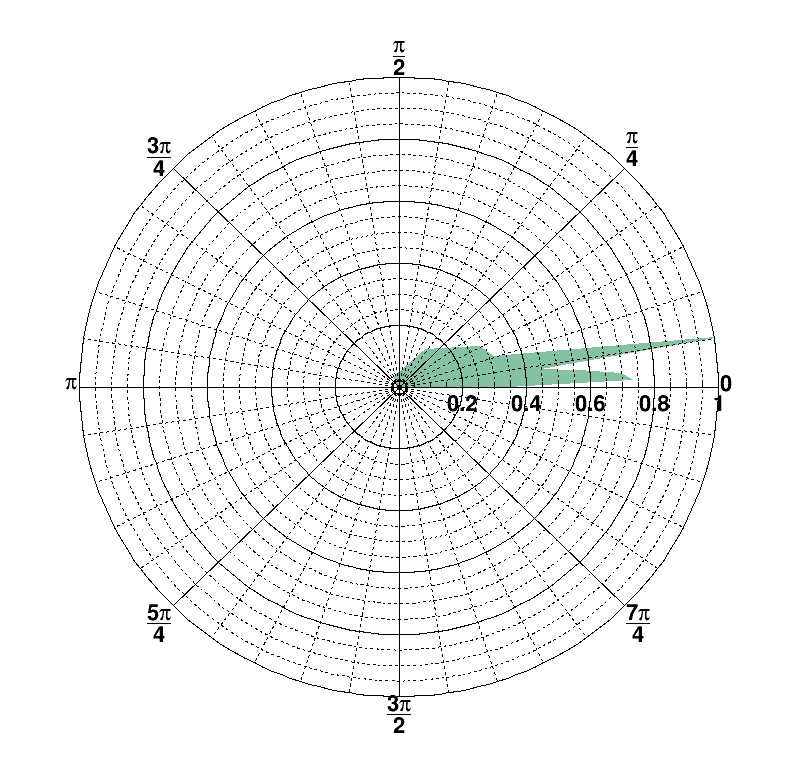
So you exploit error bars in order to draw the arcs.
I thank you for that, although it’s a bit ugly. Well… I’d like to have coloured sectors too.
I’ll wait for couet. I’ve no better idea at all.

Thank you. :slight_smile:

May be you can use TPie class?

https://root.cern/doc/master/classTPie.html

It doesn’t give the possibility to set different radii for the slices/sectors.

You could Draw("SAME") multiple TPie, each with different radius…

Uh!
You’re right! :smiley:
That’s a subtle trick but I’m sure it does the job.
Thanks! :slight_smile:

Uhm…
How do I make transparent all the sectors I don’t care about in the TPie?

Give me a minute - I have the solution! I’ll post the script when done.

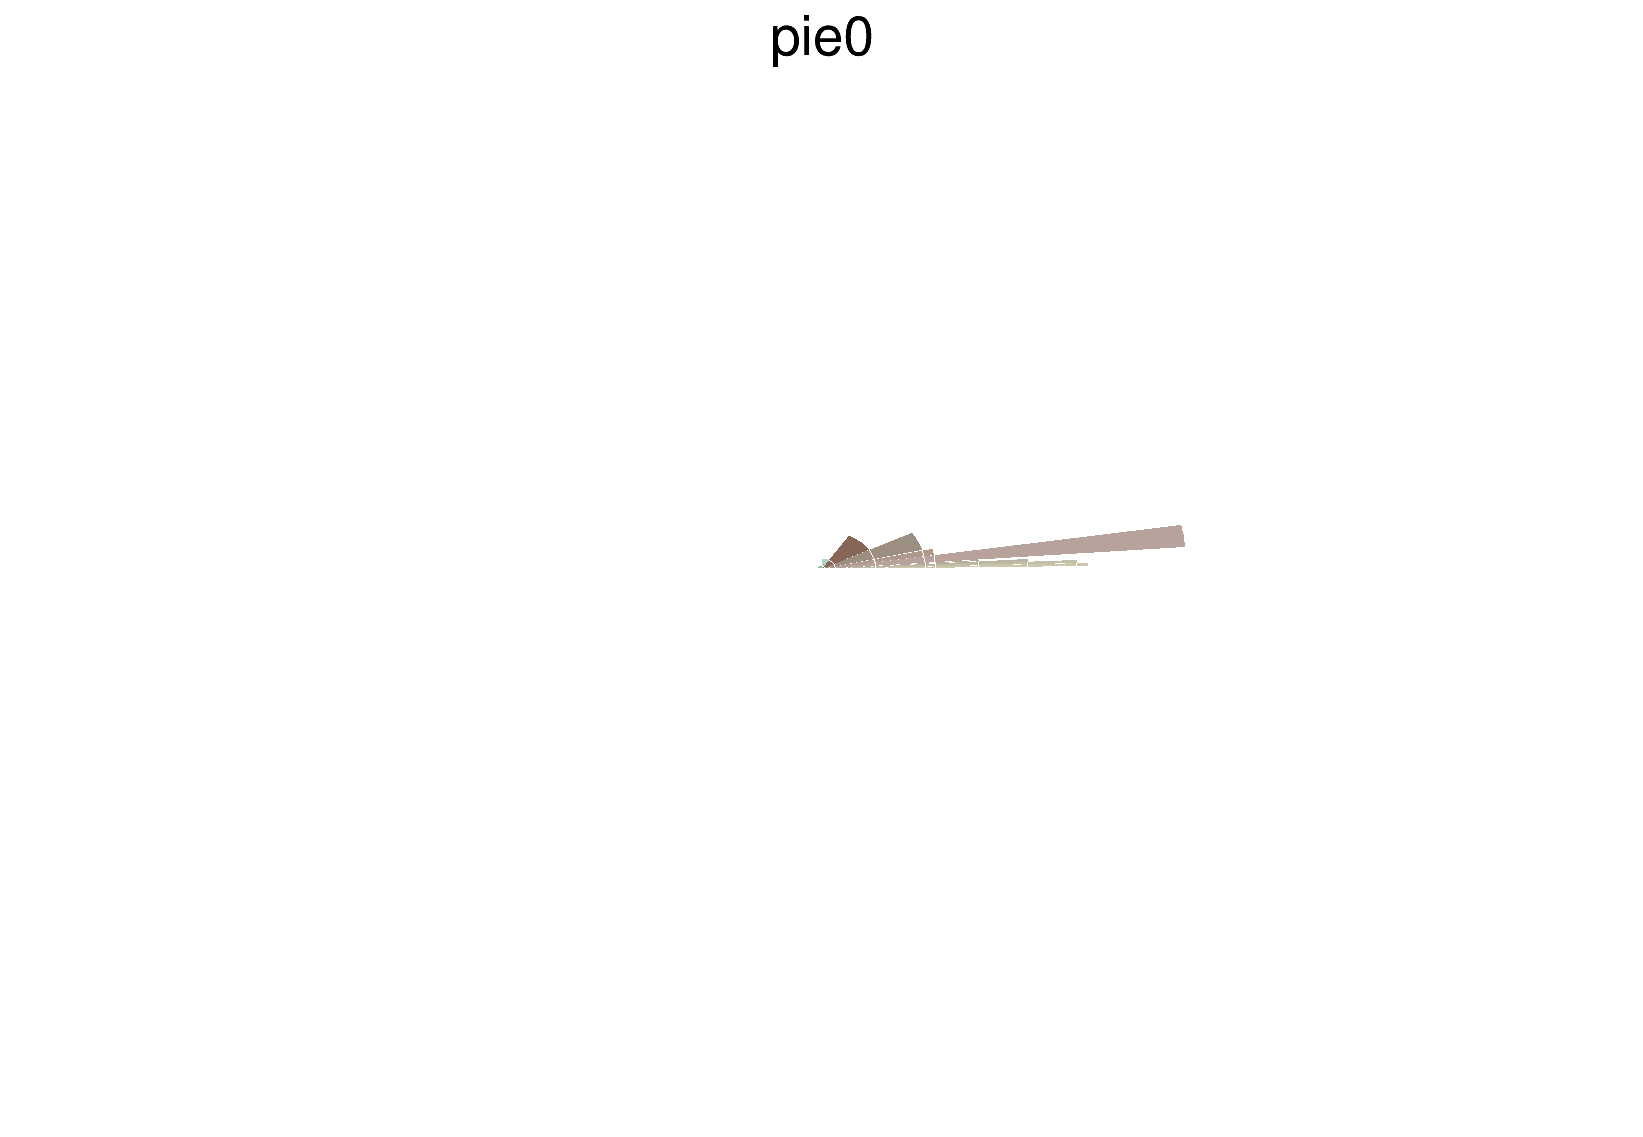
Our TPies have a bug: they paint lines even when they’re not supposed to - I think because of a fill area miscalculation. That makes the result less nice - I’ll need @couet to have a look. But this is what I have for now:

void pies()
{
  // theta upper bin borders:
  std::array<double, 12> thetaBinBorders
    = {0., 1., 2., 3., 4., 5., 10., 15., 30., 60., 90., 180.};
  std::array<double, 11> prob
    = {6.39622E-02, 1.61721E-01, 1.55263E-01, 1.25615E-01, 9.57030E-02, 2.21926E-01, 6.93081E-02, 6.31371E-02, 3.30873E-02, 8.34649E-03, 1.93071E-03};

  // Pie values are the theta bin borders.
  // Pie radii are the probabilities.

  std::array<TPie*,11> pies{};

  for (std::size_t i = 0; i < prob.size(); ++i) {
    std::string name("pie");
    name += std::to_string(i);
    std::vector<float> vals;
    int theSlice = 0;
    if (i > 0) {
      vals.emplace_back(thetaBinBorders[i]);
      theSlice = 1;
    }
    vals.emplace_back(thetaBinBorders[i + 1] - thetaBinBorders[i]);
    vals.emplace_back(360. - thetaBinBorders[i + 1]);
    pies[i] = new TPie(name.c_str(), name.c_str(), vals.size(), vals.data());
    for (int slice = 0; slice < vals.size(); ++slice) {
      if (slice == theSlice)
	pies[i]->SetEntryFillColor(slice, 20+i);
      else {
	pies[i]->SetEntryFillColor(slice, kWhite);
	pies[i]->SetEntryFillStyle(slice, 4000);
      }
    }
    pies[i]->SetRadius(prob[i]);
    pies[i]->SetLabelFormat("");
    if (i == 0)
      pies[i]->Draw("nol");
    else
      pies[i]->Draw("nol SAME");
  }
}

1 Like

Wow!
Thank you! You did all the job, thank you so much! :blush:

This topic was automatically closed 14 days after the last reply. New replies are no longer allowed.