Plot a single marker in a TGraph2D()

Dear all,

I would like to add a single Marker (square, triangle, whatever…) to my 2D plot,

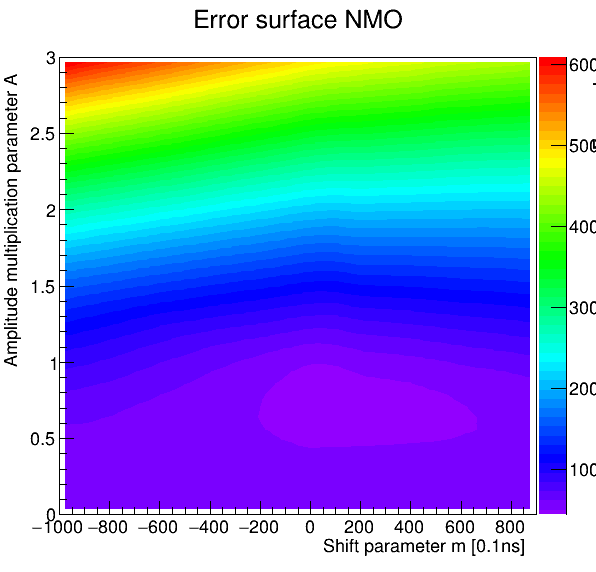
exactly where the minimum off the Function is. I have everything computed and know where to location of the minimum is, but can’t manage to get any marker into the plot.

A rough sketch of my code is:

void(){

int N=0;
int minx=0; int miny=0; int minz=0;
TGraph2D *dt4;
dt4 = new TGraph2D();

// Fill Graph
for (Double_t m=-1000.; m<1000.; m+=100) {
    for (Double_t A=0; A<3; A+=0.05) {
        z = some_function(some_parameters);
        dt4->SetPoint(N,m,A,z);
        N++;
        if (z < minz){ // Look for minimum
            minz = z;
            minx = m;
            miny = A;
        }
    }
}

// Transform to hist
hist4 = dt4->GetHistogram();

// Plot
hist4->SetContour(20);
hist4->Draw("CONT4Z");
c4->Draw();
}

Any idea is welcome!


_ROOT Version: 6.14
_Platform: Ubuntu 18.04
_Compiler: Don’t know (Root Kernel in Jupyter Notebook), otherwise gcc 7.4.0


Hi @lnies, welcome here.
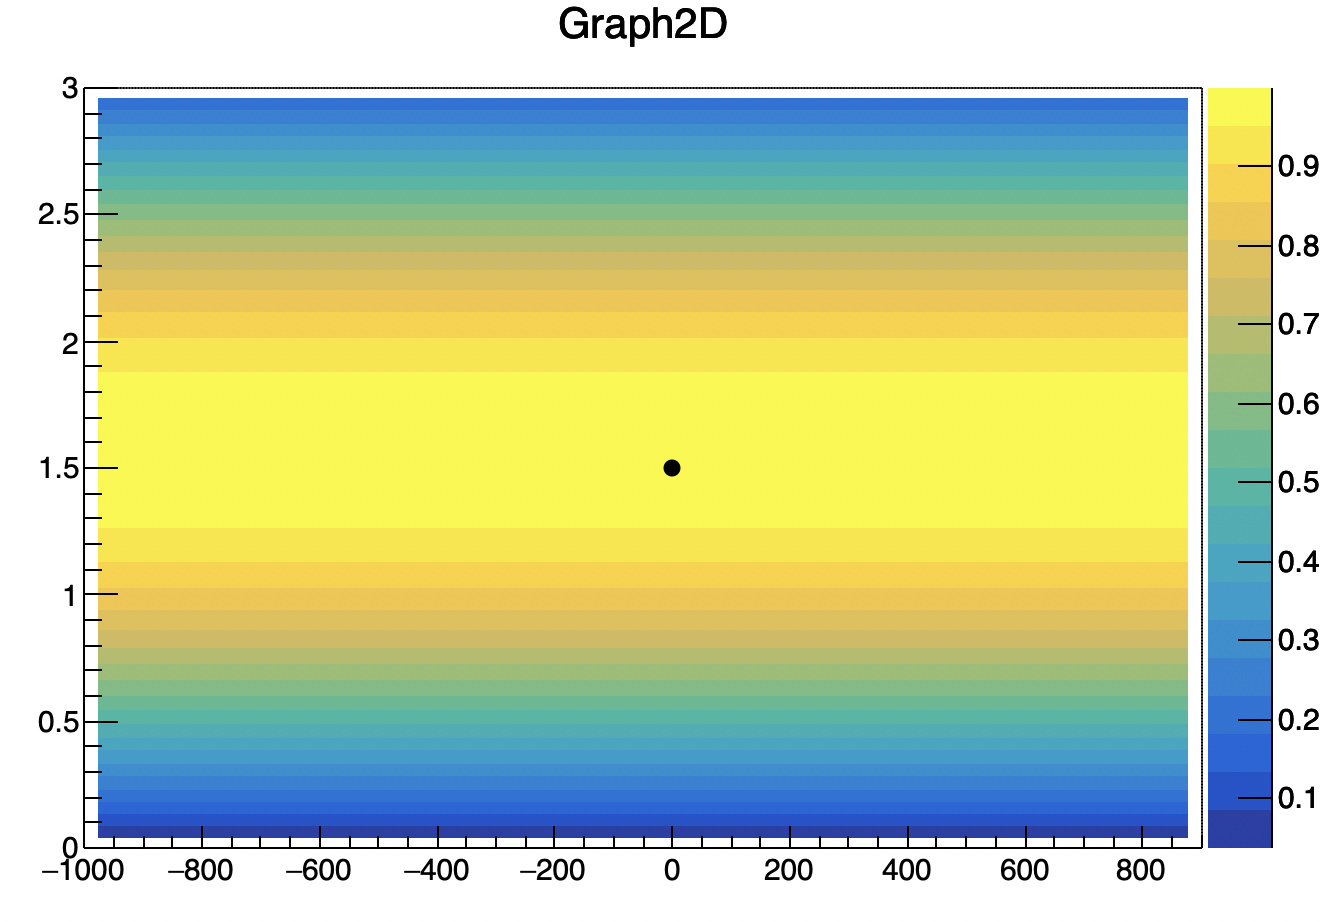
This is the simplest idea that came to my mind, maybe there are smarter way to do it.
Declare a new TGraph and add just one point, then change the marker to a star and draw it.
Below just a simple way to implement it.

TGraph *min = new TGraph();
min->SetPoint(0,minx,miny);
min->SetMarkerStyle(29);
min->SetMarkerColor(kRed);
min->Draw("Psame");

Cheers,
Stefano

@couet Usual “CONT4” (a.k.a. “SURF at theta = 0”) annoyance.

void cont4same3() {

   int N=0;
   int minx=0; int miny=0; int minz=0;
   double z;
   auto dt4 = new TGraph2D();

   // Fill Graph
   for (Double_t m=-1000.; m<1000.; m+=100) {
       for (Double_t A=0; A<3; A+=0.05) {
           z = sin(A);
           dt4->SetPoint(N,m,A,z);
           N++;
           if (z < minz){ // Look for minimum
               minz = z;
               minx = m;
               miny = A;
           }
       }
   }

   // Transform to hist
   auto hist4 = dt4->GetHistogram();

   // Plot
   hist4->SetContour(20);
   hist4->Draw("CONT4Z");

   // Draw a marker
   Double_t BM = gPad->GetBottomMargin();
   Double_t LM = gPad->GetLeftMargin();
   Double_t RM = gPad->GetRightMargin();
   Double_t TM = gPad->GetTopMargin();
   Double_t X1 = hist4->GetXaxis()->GetXmin();
   Double_t Y1 = hist4->GetYaxis()->GetXmin();
   Double_t X2 = hist4->GetXaxis()->GetXmax();
   Double_t Y2 = hist4->GetYaxis()->GetXmax();

   TPad *null=new TPad("null","null",0,0,1,1);

   null->SetFillStyle(0);
   null->SetFrameFillStyle(0);
   null->Draw();
   null->cd();
   null->Range(X1-(X2-X1)*(LM/(1-RM-LM)),
               Y1-(Y2-Y1)*(BM/(1-TM-LM)),
               X2+(X2-X1)*(RM/(1-RM-LM)),
               Y2+(Y2-Y1)*(TM/(1-TM-LM)));

   gPad->Update();
   auto mark = new TMarker(0,1.5,20);
   mark->Draw();

}

1 Like

Yes, that works nicely! Thanks!

This topic was automatically closed 14 days after the last reply. New replies are no longer allowed.