Hi,
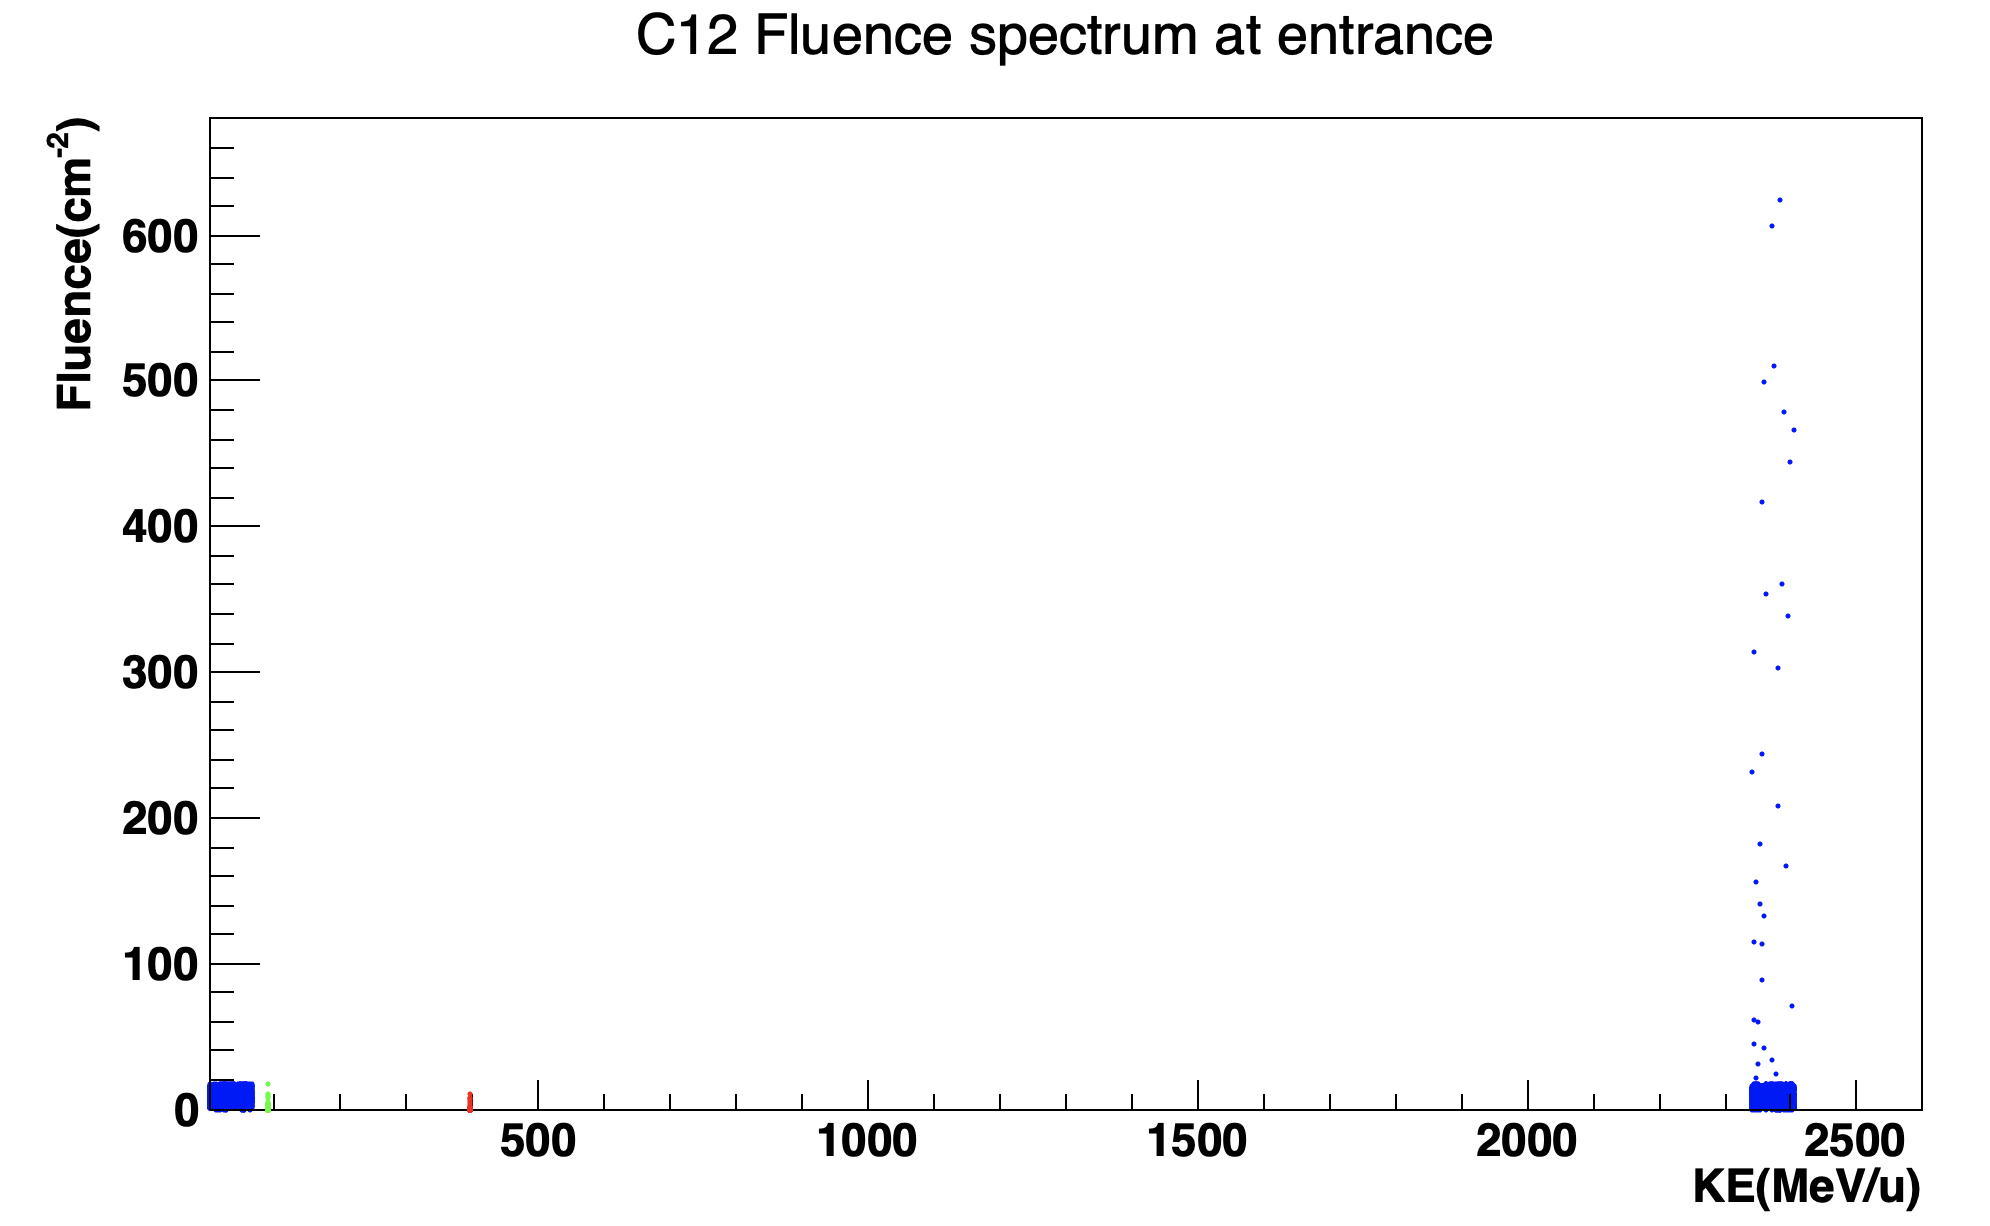
I am trying to plot two, predefined 2-D histograms, from a tree on the same canvas. Both histograms should have the same x-axis range. However, when I plot them using the “same” option. I only get the first histogram with a modified range. The other histogram which should have data at the lower end of the axis is not plotted at all. I am including the code below:
One solution is to plot “histo1” (with larger range) first, without the cut on “kinEnergy”, which consequently fills the very low energy bin (for histo1) and plots both histograms with the entire x-axis range. I would like to know if there is a way to force both histograms to be plotted with the predefined x-range and including the cuts.
Hi Olivier,
My apologies but I couldn’t upload individual root files for some reason so I have uploaded them (there are 3 hosts) as a zipped file.
Thanks,
Deepak
void f(){
   auto file = new TFile("f.root");
   auto h1 = (TH2F*)file->Get("histofluenceKEC12_0");
   auto h2 = (TH2F*)file->Get("histofluenceKEH1_0");
   auto h3 = (TH2F*)file->Get("histofluenceKEHe4_0");
   h1->Draw("");
   h2->Draw("SAME");
   h3->Draw("SAME");
}
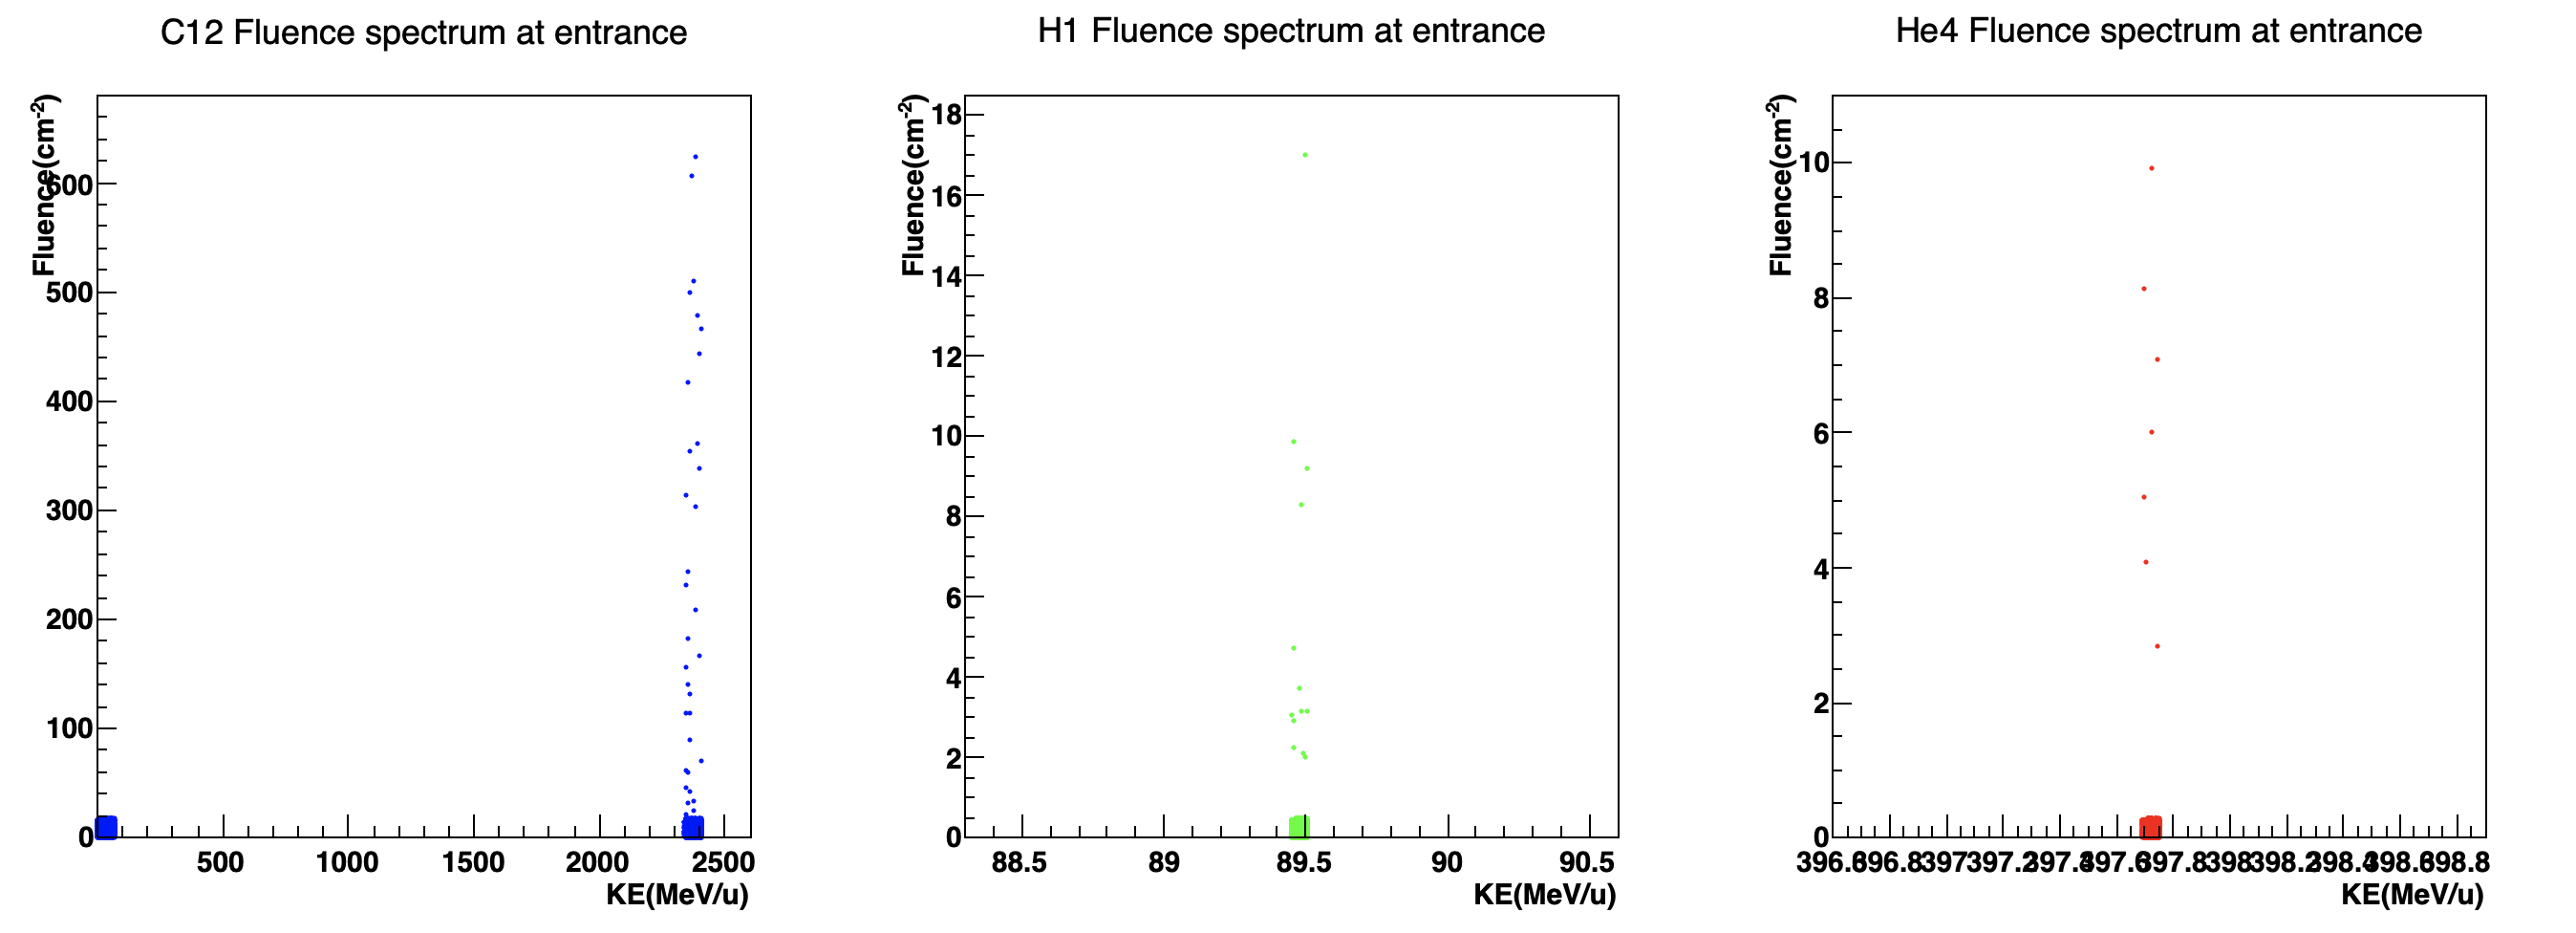
Your histograms do not have at all the same ranges:
void f(){
   auto file = new TFile("f.root");
   auto h1 = (TH2F*)file->Get("histofluenceKEC12_0");
   auto h2 = (TH2F*)file->Get("histofluenceKEH1_0");
   auto h3 = (TH2F*)file->Get("histofluenceKEHe4_0");
   auto c = new TCanvas();
   c->Divide(3,1);
   c->cd(1); h1->Draw("");
   c->cd(2); h2->Draw("");
   c->cd(3); h3->Draw("");
}
Thanks a lot for working on it. I am just curious about one more thing. If I get rid of the low energy bin in histo1 (“kinEnergy>1”) then I lose the control over x-axis and can no longer plot together in the same canvas. Like, the histo2 and histo3 don’t start from 0. I just learnt how to save histograms in a root file with a TList. histograms.root.zip (4.8 KB)
My apologies that somehow the histograms did not add to the list. I would like to plot three histograms on a single canvas with a x-axis ranging from 0-2500. It is only possible, if I do not apply any cut (eg. fluence>0). In case of such a cut, the histogram x-axis is auto-adjusted around the first histogram. It would be great to know if there is a work around. I’ve attached the root file with the tree.
Thanks. DoseDistribution.zip (2.3 MB)
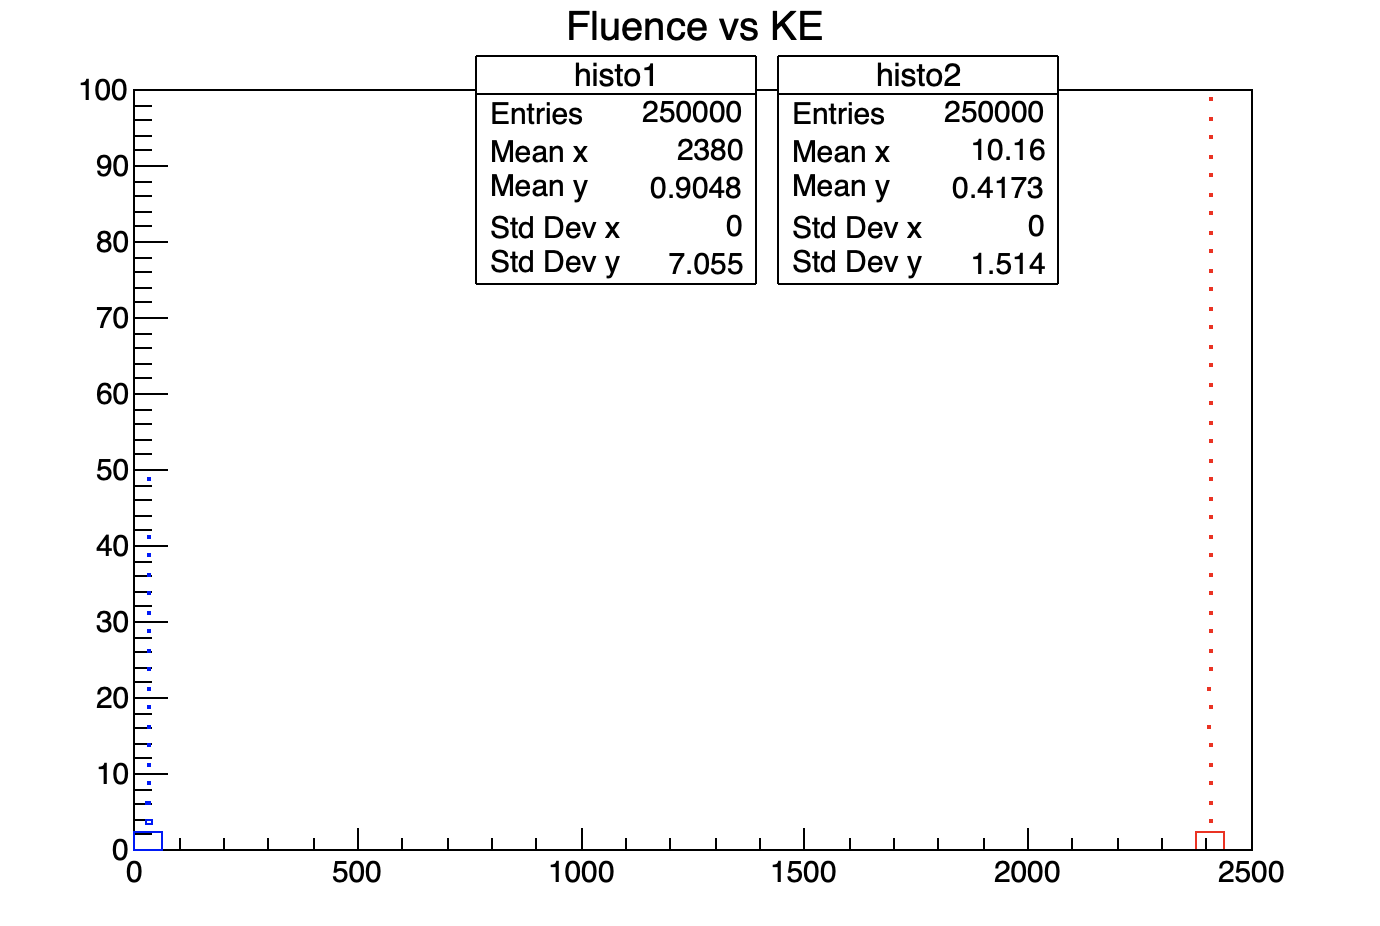
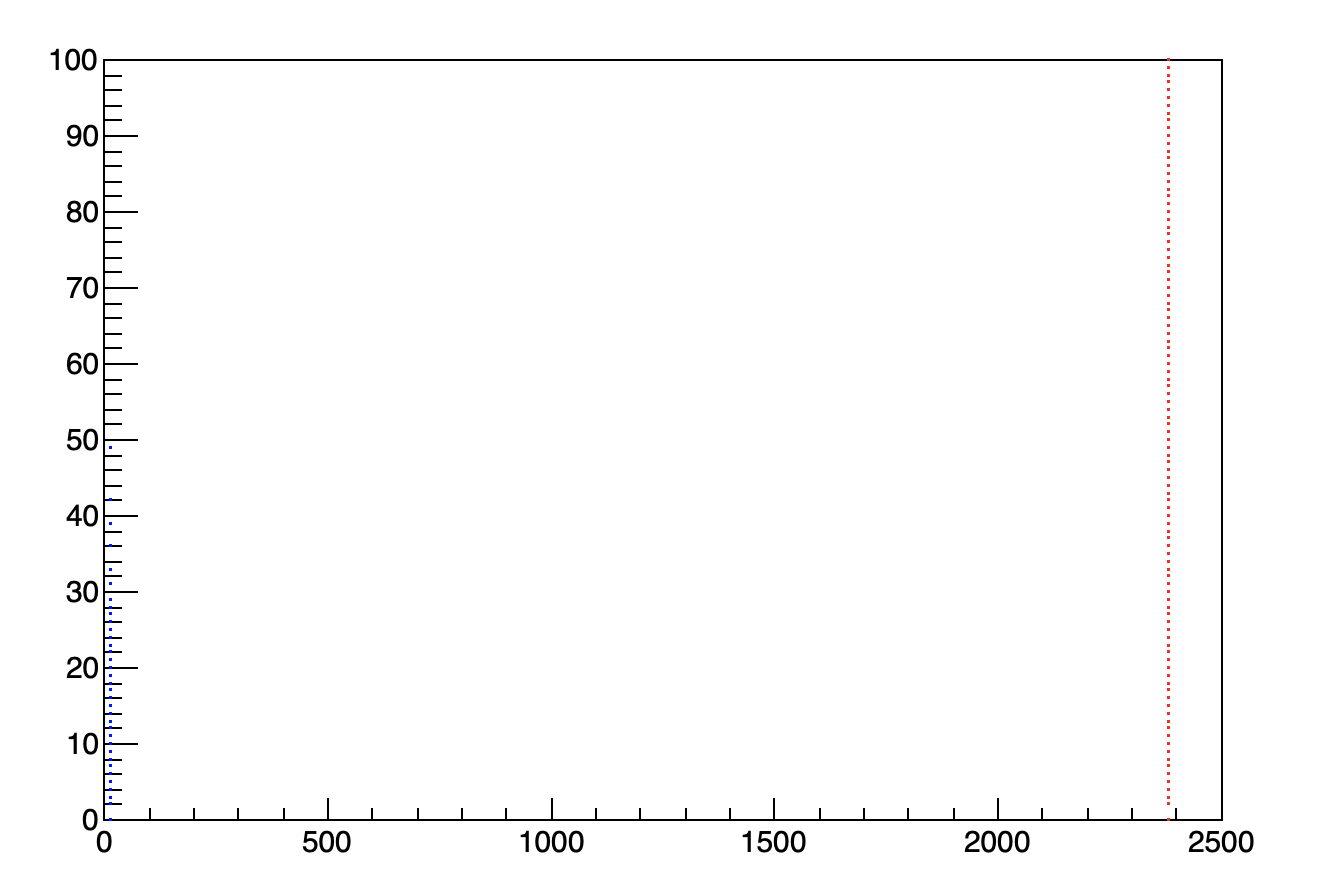
When you plot the histograms with marker, that’s not the individual event you see but random points plotted in the bins (see THisPainter option SCAT). You better use an other option like BOX or COL:
void dsh(){
   auto f = new TFile("DoseDistribution.root");
   TTree *mytree = (TTree*)f->Get("fluenceFragNtuple");
   auto histo1 = new TH2F("histo1", "Fluence vs KE", 40, 0, 2500, 40, 0, 100);
   auto histo2 = new TH2F("histo2", "Fluence vs KE", 40, 0, 2500, 40, 0, 100);
   mytree->Draw("fluence:kinEnergy>>histo1","Z==6 && A==12 && kinEnergy>0","nodraw");
   mytree->Draw("fluence:kinEnergy>>histo2","Z==1 && A==1 && kinEnergy>0","nodraw");
   TH2F* h1 = (TH2F*)gROOT->FindObject("histo1");
   TH2F* h2 = (TH2F*)gROOT->FindObject("histo2");
   h1->SetLineColor(2);
   h2->SetLineColor(4);
   h1->Draw("BOX");
   h2->Draw("BOX SAMES");
}