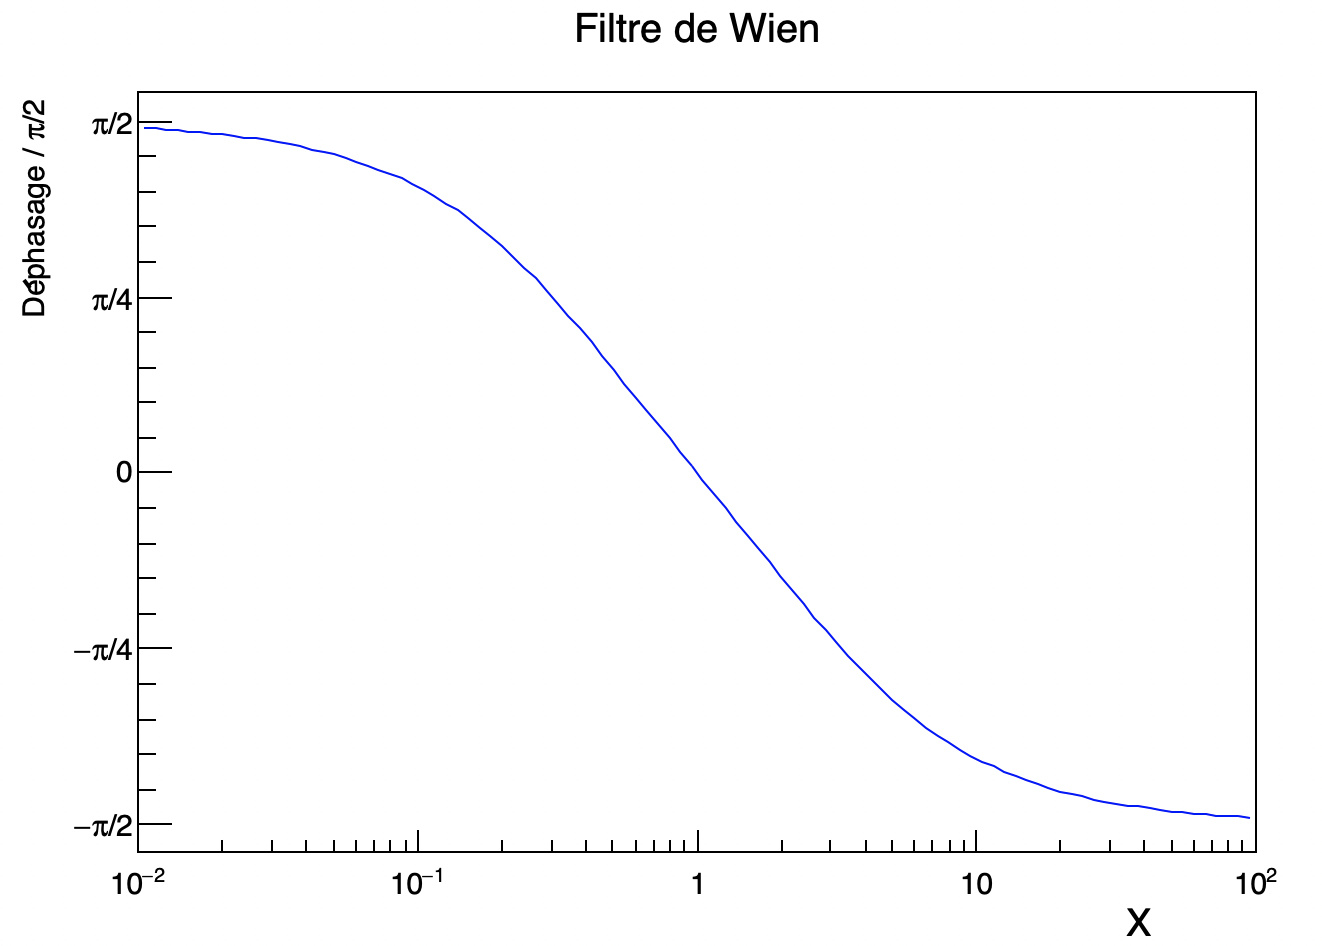
Dear all,
Many thanks in advance. Johann
 double SE(double * var , double * par){
  double  x = var[0] ;
  const double pi2 = acos(-1)/2. ;
  double value = atan((1/x - x)/3.)/pi2 ;
  return value ;
}

void Dephasage_Wien() { // filtre de Wien

 TF1 * f1 = new TF1("f1",SE,0.01,100.,0) ;
f1->SetLineColor(kBlue);
f1->SetTitle("Filtre de Wien");
TAxis* ax = f1->GetXaxis() ;
TAxis* ay = f1->GetYaxis() ;
ax->SetTitle("X          ");
ay->SetTitle(" D#acute{e}phasage / #pi/2 ");
ax->SetTitleSize(0.045);
ax->SetTitleSize(0.045);
ax->SetTitleOffset(1.);
ay->ChangeLabel(-1,-1,-1,-1,-1,-1,"#pi/2");
ay->ChangeLabel(2,-1,-1,-1,-1,-1,"-#pi/4");
ay->ChangeLabel(1,-1,-1,-1,-1,-1,"#-pi/2");
f1->Draw() ;
gPad->SetLogx(1) ;


}
couet
June 25, 2020, 12:10pm
3
double SE(double * var , double * par){
   double  x = var[0] ;
   const double pi2 = acos(-1)/2. ;
   double value = atan((1/x - x)/3.)/pi2 ;
   return value ;
}

void Dephasage_Wien() { // filtre de Wien

   TF1 * f1 = new TF1("f1",SE,0.01,100.,0) ;
   f1->SetLineColor(kBlue);
   f1->SetTitle("Filtre de Wien");
   f1->Draw();
   gPad->SetLogx(1) ;
   gPad->Update();

   TAxis* ax = f1->GetXaxis() ;
   TAxis* ay = f1->GetYaxis() ;
   ax->SetTitle("X          ");
   ay->SetTitle(" D#acute{e}phasage / #pi/2 ");
   ax->SetTitleSize(0.045);
   ax->SetTitleSize(0.045);
   ax->SetTitleOffset(1.);

   ay->ChangeLabel(-1,-1,-1,-1,-1,-1,"#pi/2");
   ay->ChangeLabel(-2,-1,-1,-1,-1,-1,"#pi/4");
   ay->ChangeLabel(2,-1,-1,-1,-1,-1,"-#pi/4");
   ay->ChangeLabel(1,-1,-1,-1,-1,-1,"-#pi/2");
}
Many thanks for your quick fix ! Johann
couet
June 25, 2020, 12:22pm
5
Basically ChangeLabels works on existing plots. You need first to produce fully the plot with all the options (gPad->Update() does that). Then you can get the axis and start changing them.
Now that you wrote it, it sounds logical, but this is clearer after than before. Many thanks again.