Hi dears ROOTers
I have a problem when finding peaks that may be has a relation to the period of scanning the peaks
for example if I want to find all peaks I can’t. Then if I multiply npeaks it just multiply the peak finding around the same peak but not all peaks which I want to fit it .
Could you please tell me how can I adjust the macro to be suitable to find and fit all peaks as the data which I will attache it
I’ll be always grateful to you dears
data.txt (116 KB)
peaks.C (2.79 KB)
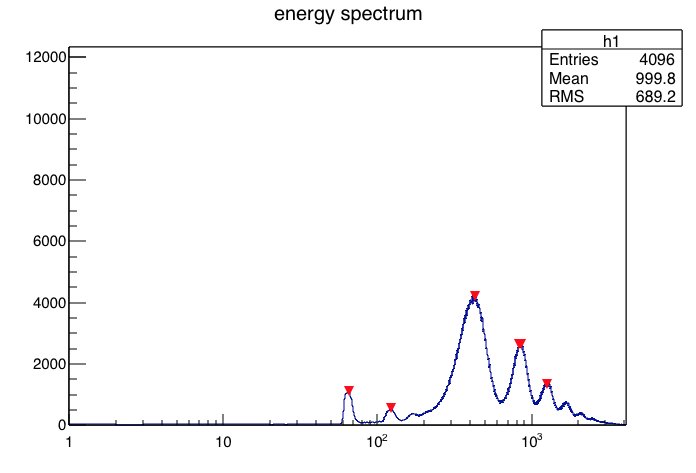
OK dear very good
but there still about 2 or 3 peaks in the right of the histogram not fitted
Hi,
It is not an easy task to find automatically peaks in the spectrum. You can try to play a bit with the options of the TSpectrum class (look at its documentation), but the class is not perfect and it might not work correctly for all the cases. It could be useful maybe to split the histogram in different regions, depending on the background contribution
Best Regards
Lorenzo
OK dears couet and Lorenzo thanks a lot
[quote=“moneta”]Hi,
It is not an easy task to find automatically peaks in the spectrum. You can try to play a bit with the options of the TSpectrum class (look at its documentation), but the class is not perfect and it might not work correctly for all the cases. It could be useful maybe to split the histogram in different regions, depending on the background contribution
Best Regards
Lorenzo[/quote]
Hello dears Lorenzo and quote
I tried to split the histogram as your guidance then it was ok for all first five peaks but after moving to the 2 last peaks then there still something wrong about it for example, the parameters like (sigma) was not as expected. I mean that it appeared as a negative value. Could you please help me to split the histogram to find the parameters like (sigma and mean) specially for that last 2 peaks
and thank you for always dears.
Hello dears
I tried to split the histogram as your guidance then it was ok for all first five peaks but after moving to the 2 last peaks then there still something wrong about it for example, the parameters like (sigma) was not as expected. I mean that it appeared as a negative value. Could you please help me to split the histogram to find the parameters like (sigma and mean) specially for that last 2 peaks
and thank you for always dears.[/quote]