Hello all,
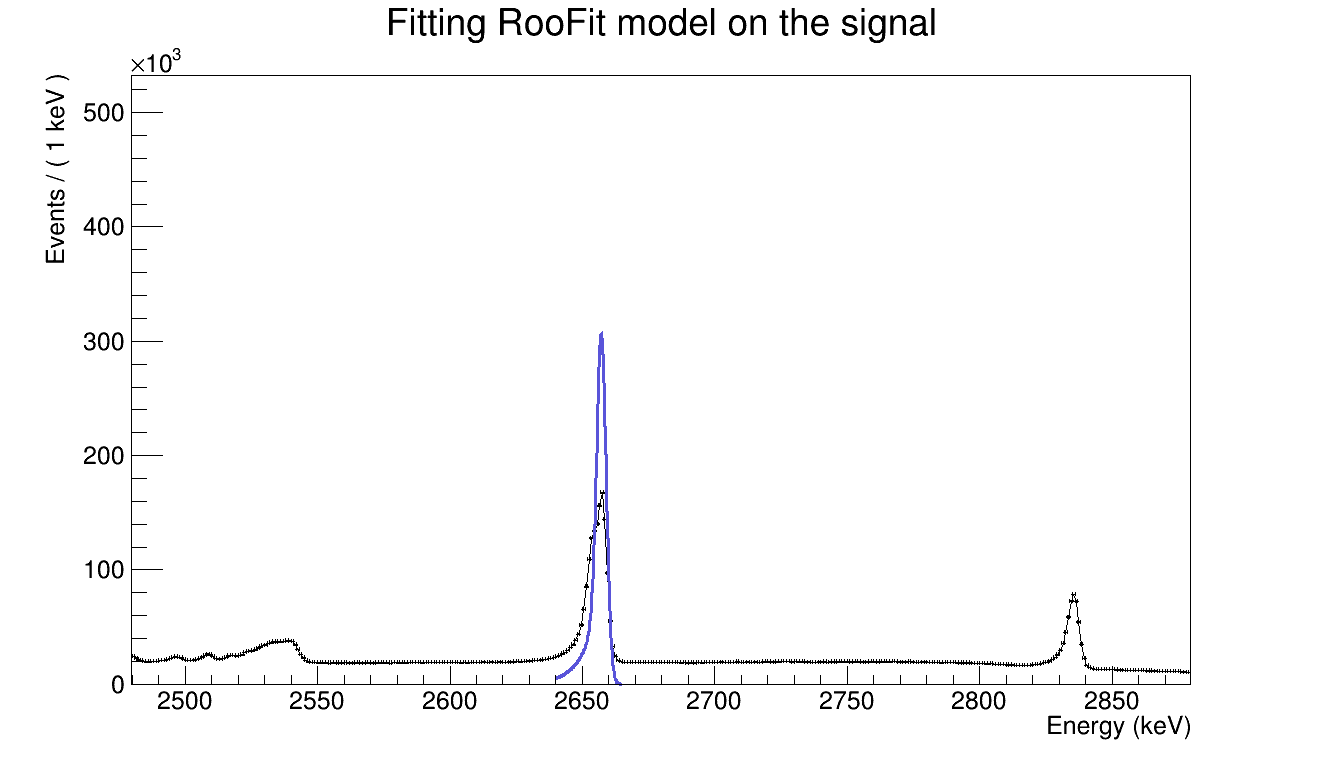
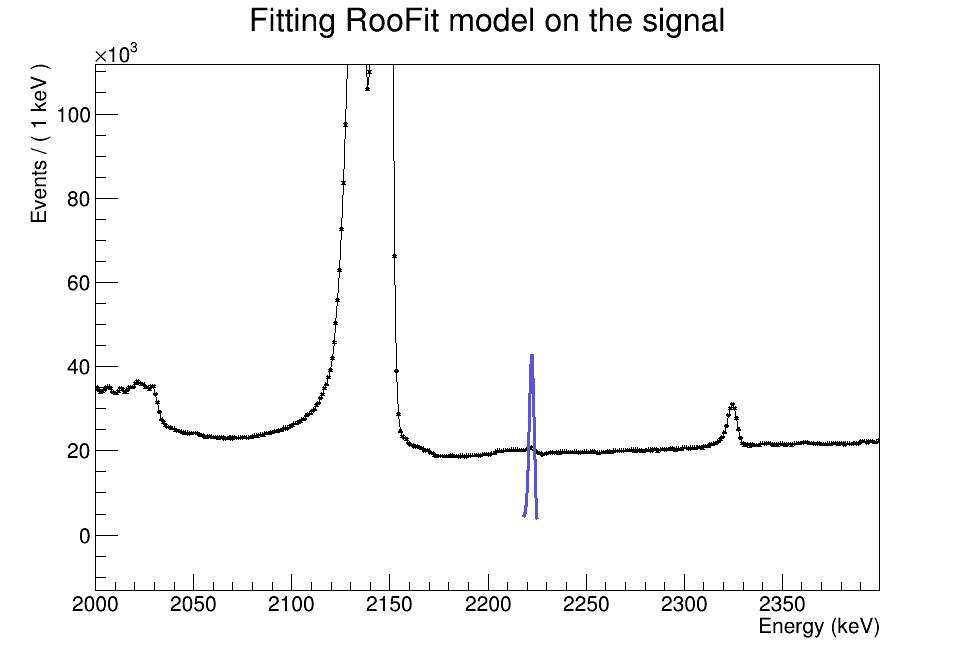
I am trying to fit a complex function onto some peaks in a histogram. The code runs fine but the fit shape overshoots and doesn’t really fit well on the peaks. I am attaching a couple of examples of what it looks like and also my code:
void roofit_fitting(){

    TString FileNameRoot1 = "allProcessedTrees.root";
    TFile *f1 = new TFile(FileNameRoot1);

    TH2F* hGeEnergyVsTimePP5000to2200Veto = (TH2F*)(f1->FindObjectAny("hGeEnergyVsTimePP5000to2200Veto"));
    TH1* h1 = hGeEnergyVsTimePP5000to2200Veto->ProjectionX("a",496,502);

    RooRealVar E1("E1","Energy",0,7999,"keV");
    RooPlot* frame1 = E1.frame(Title("Fitting RooFit model on the signal"));
    RooDataHist data1("data1","dataset with E",E1,h1);
    data1.plotOn(frame1,DrawOption("L"));

    RooRealVar pi("pi","pi value = 3.14159...",3.14159265);
	RooRealVar Lw("Lw","Voigt line width of 4d5/2->2p3/2", 0.0,"keV");
    float data_numEntries   = data1.numEntries();
	float data_sumEntries   = data1.sumEntries();
    RooRealVar m("m","gaussian mean", 2222., 2218, 2225,"keV");
	RooRealVar s("s","gaussian sigma",1.208,"keV");
    //RooRealVar m("m","gaussian mean", 2653., 2640, 2665,"keV");
    //RooRealVar s("s","gaussian sigma",1.80,"keV");
	RooRealVar b("b","slope of exponential tail",6.0,"keV");
	RooRealVar fV("fV","Voigt fraction",0.9,0.7,1.0); // (weight) fraction of VOIGT G
	RooFormulaVar fD("fD","1-fV",RooArgList(fV));  //(weight) fraction of tail function
	RooRealVar nSig("nSig","number of events expected in Signal region",100.,data_sumEntries);
	RooRealVar A("A","A",0., "keV^{-1}");
	RooGenericPdf Sig("Sig","  fV* TMath::Voigt(E1-m,s,Lw) + fD * (1./(2.*b)) * exp( ((E1-m)/b) + (s*s)/(2.*b*b))* ROOT::Math::erfc(((E1-m)/(sqrt(2.)*s))+(s/(sqrt(2.)*b))) + A * 0.5 * ROOT::Math::erfc((E1-m)/(sqrt(2.)*s))",RooArgList(fV,pi,E1,m,Lw,s,fD,b,A));
    Sig.fitTo(data1,Range(2218,2225));
    //Sig.fitTo(data1,Range(2640,2665));
    Sig.plotOn(frame1,LineColor(9));
    frame1->Draw("same");

}
I want it to trace the peaks. I agree the function is not straightforward and a lot of parameters go into the function. Could the values I am passing for those parameters be the reason or am I making an obvious mistake here? Any help is appreciated! Thank you!