Hi All,
I am attempting to use PCA to analyze some data. I wanted to start with something simple to I decided to use the iris data set (https://en.wikipedia.org/wiki/Iris_flower_data_set#Data_set). I modified principle.C (available in the math directory in the tutorials) and seem to be getting reasonable results.
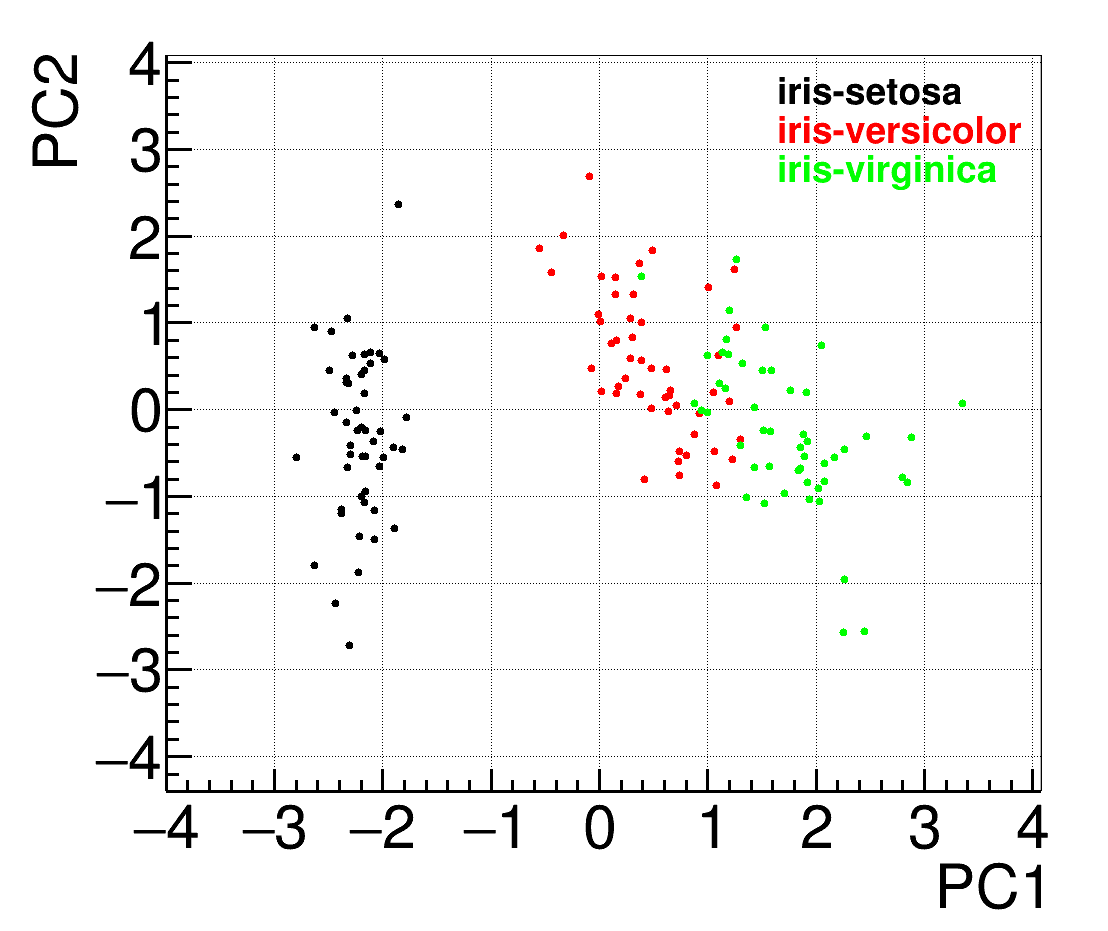
My issue is that I am not sure how to pull out correlated entries in the histograms for the individual principal components. Basically, I would like to plot PCA1 versus PCA2 or any combination of the principal components. I have provided the script I am currently using. principal.C (2.5 KB)
Thanks,
Jason