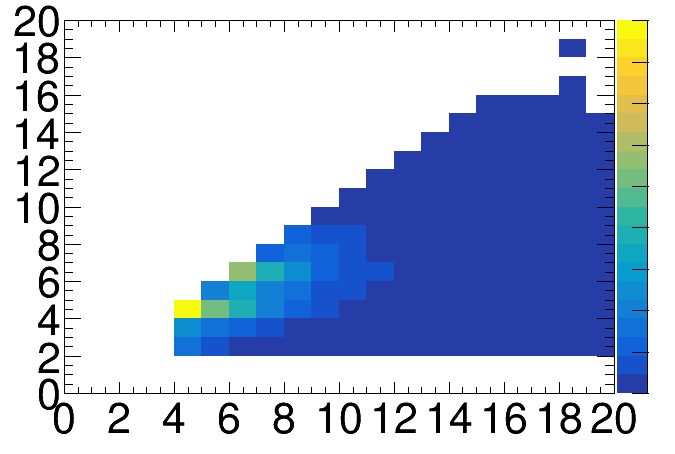
I am trying to plot some 2D histogram with COLZ option in Jupyter notebook reading a root file with TChain
``chain = ROOT.TChain(tree)
c2 = ROOT.TCanvas(“c2”, “c2”)
h2 = ROOT.TH2D(“h2”, “h2”, 20, 0, 20, 20, 0, 20)
h2.Draw(“COLZ”)
_ROOT Version: 6Compiler: Not Provided
couet
May 23, 2022, 9:08am
2
What do you mean ? can you send a screen dump ?
I mean the number of entries for each color in the palette. Sorry, I was not clear.
couet
May 23, 2022, 9:16am
4
Ah ok. The axis labels.
c2 = ROOT.TCanvas("c2", "c2", 700, 500)
Changing “700” to higher values, does not change anything, just the size of the canvas.
Oh, it works, thank you a lot. I didn’t find an answer to this anywhere.
couet
May 23, 2022, 9:29am
8