Hi,
I want to overlay two histograms containing the distribution of two samples each. I have based myself on the tutorial transpad.C, however the tutorial only accounts for different y-axis, not a different x-axis.
This is the code I’m currently using:
TCanvas *c1 = new TCanvas("c1","transparent pad",200,10,700,500);
   TPad *pad1 = new TPad("pad1","",0,0,1,1);
   TPad *pad2 = new TPad("pad2","",0,0,1,1);
   pad2->SetFillStyle(4000); //will be transparent
   pad1->Draw();
   pad1->cd();
pad1->SetLogy();
EnWeightMc->Draw("H");
EnMc->Draw("][HSAME");
pad1->Update();
c1->cd();
Double_t xmin=0;
Double_t xmax=1;
 Double_t dx = (xmax-xmin)/0.8;
Double_t ymax=1*(HadMc->GetMaximum());
Double_t ymin=10;
Double_t dy = (ymax-ymin)/0.8;
pad2->Range(xmin-0.1*dx,ymin-0.1*dy,xmax+0.1*dx,ymax+0.1*dy);
pad2->Draw();
pad2->cd();
pad2->SetLogy();
 HadWeightMc->Draw("][HSAME");
 HadMc->Draw("][HSAME");
 pad2->Update();
 TGaxis *axis = new TGaxis(xmax,ymin,xmax,ymax,ymin,ymax,510,"-G=");
 axis->Draw();
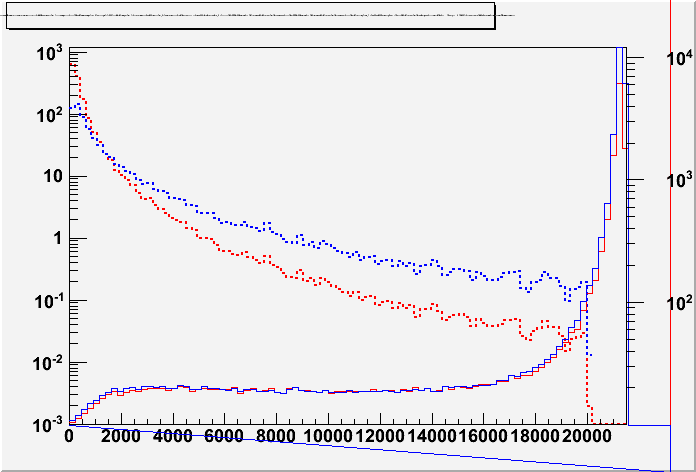
The resulting plot is shown as an attachment. the x-axis shown is the one of pad1. The x-axis of the second pad goes from 0 to 1 and I don’t need it to be shown.
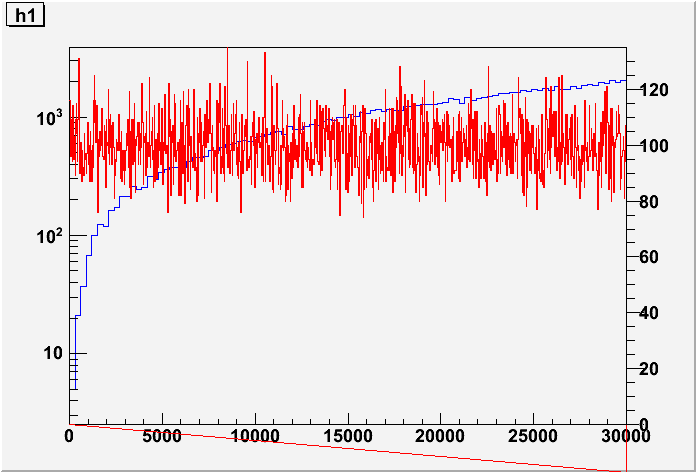
I don’t quite understand where the blue triangle underneath the plot and the red line on the right come from and how to remove them? I’m guessing it has to do with the pad sizes not matching up, but I can’t seem to fix it. Any help would be appreciated! 
regards myrti
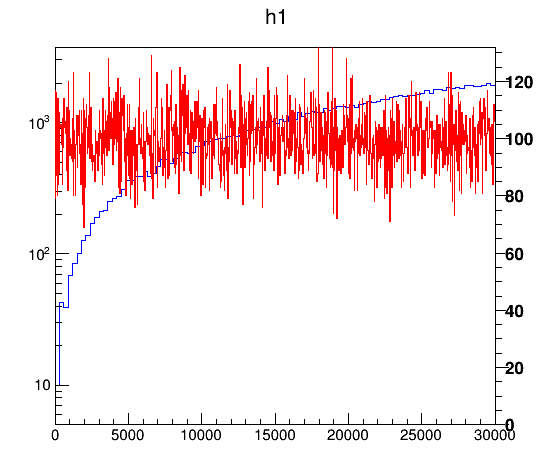
 Therefore the problem is solved for me. Thanks!