Dear experts,
To draw the figure in the paper, I need to remove the ticks on the right side of the x-axis or only show the ticks in the subrange of the axis. Does someone face a similar problem?
Thanks in advance.
Best
Liuyao.
Dear experts,
To draw the figure in the paper, I need to remove the ticks on the right side of the x-axis or only show the ticks in the subrange of the axis. Does someone face a similar problem?
Thanks in advance.
Best
Liuyao.
Surely something can be done. Do you have some macro we can start from ?
Of course the simplest way is to change your histogram range:
auto hsub1 = new TH1D("hsub1", ";<N_{trk.}>; ", 205, 20, 140);
@couet,
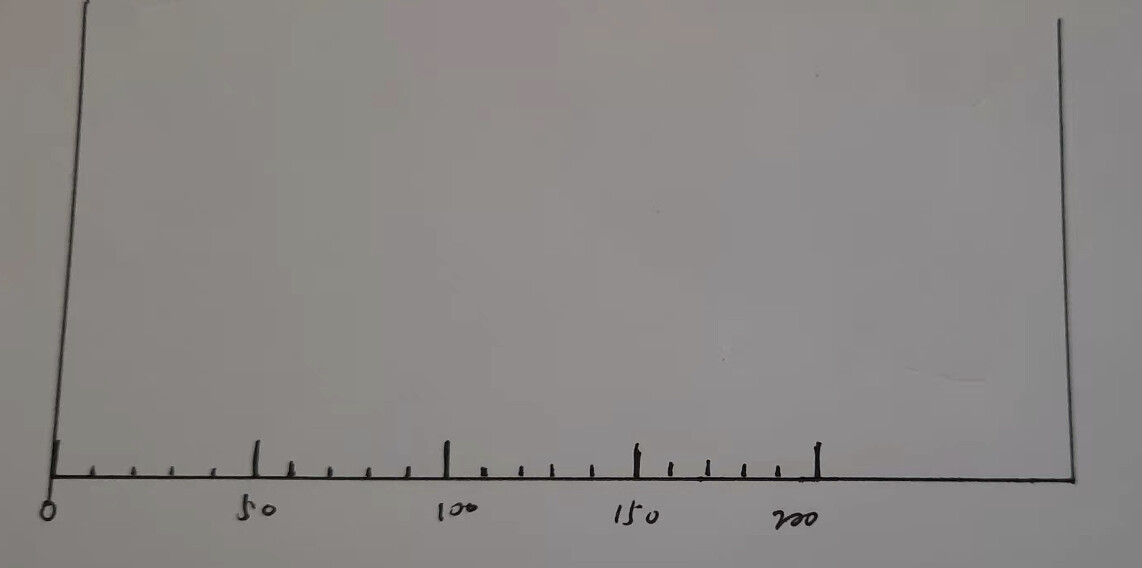
Hi Couet, based on the current results, I try to distribute the x-axis(0-200) not filling all pad space. Namely, there is no ticks after end-point of x-axis. Just like the schematic diagram.
So you want to extend the x-axis after 200 without ticks after 200 ?
Yes, you are right.
{
const double multiply_f = 5.0;
//depression in pp
const int n = 3;
double x[n] = {30, 80, 130};
double y[n] = {0.0395622, 0.0454451, 0.0359729};
double ex[n] = {0, 0, 0};
double ey[n] = {0.0101898, 0.0101015, 0.00633634};
for(int i=0; i<n; i++) {
y[i] *= multiply_f;
ey[i] *= multiply_f;
}
auto dep_pp = new TGraphErrors (n, x, y, ex, ey);
dep_pp->SetLineColor(1);
dep_pp->SetLineStyle(1);
dep_pp->SetLineWidth(4);
//Draw the diagram --------------------------------------------------------------------
auto csub1 = new TCanvas("csub1", "", 600, 600);
csub1->SetTicks(1,1);
csub1->SetPad(0.02, 0.02, 0.98, 0.99);
csub1->SetTopMargin(0.10);
csub1->SetBottomMargin(0.18);
csub1->SetLeftMargin(0.15);
csub1->SetRightMargin(0.05);
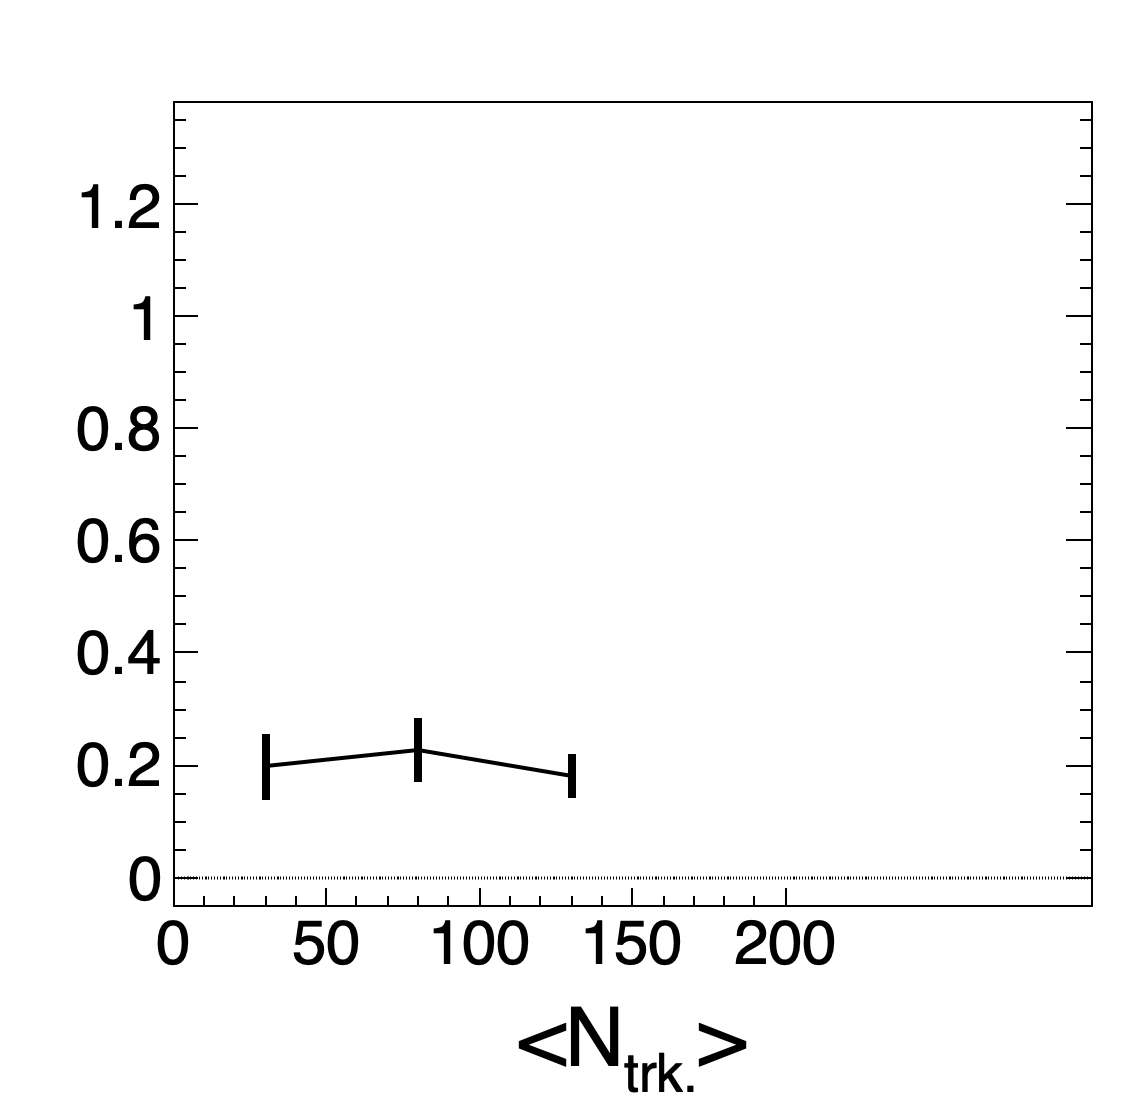
auto hsub1 = new TH1D("hsub1", ";<N_{trk.}>; ", 205, 0, 300);
hsub1->SetLineWidth(0);
hsub1->SetStats(kFALSE);
hsub1->GetXaxis()->CenterTitle();
hsub1->GetYaxis()->CenterTitle();
hsub1->GetXaxis()->SetTitleOffset(1.02);
hsub1->GetYaxis()->SetTitleOffset(1.15);
hsub1->GetYaxis()->SetLabelOffset(0.01);
hsub1->GetXaxis()->SetTitleSize(0.08);
hsub1->GetYaxis()->SetTitleSize(0.08);
hsub1->GetXaxis()->SetTitleFont(42);
hsub1->GetYaxis()->SetTitleFont(42);
hsub1->GetXaxis()->SetLabelFont(42);
hsub1->GetYaxis()->SetLabelFont(42);
hsub1->GetXaxis()->SetLabelSize(0.);
hsub1->GetXaxis()->SetTickSize(0.);
hsub1->GetYaxis()->SetLabelSize(0.06);
hsub1->GetYaxis()->SetRangeUser(-0.05, 1.38);
hsub1->GetXaxis()->SetNdivisions(505);
hsub1->Draw();
auto axis = new TGaxis(0,-0.05,200,-0.05,0,200,505,"");
axis->SetTitleOffset(1.02);
axis->SetLabelFont(42);
axis->SetLabelSize(0.06);
axis->Draw();
auto data_line = new TF1("data_line", "0.0",0, 500);
data_line->SetLineColor(1);
data_line->SetLineWidth(3);
data_line->SetLineStyle(3);
data_line->Draw("Lsame");
dep_pp->Draw("LE");
}
Hi couet,
Perfect, thanks a lot for your help.
Best
Liuyao.