I’m making an online monitoring application, expecting to have kHz of data to arrive from a socket, and be plotted.
Total number of histograms is order of 20.
I have followed the examples in other posts (for using QWidget to embed TCanvas as QMainCanvas class in a GUI etc).
I want to improve the refresh rate.
Should I have the histograms in one canvas and do Modified() and Update() on each Pad sequentially?
Should I have a Canvas foreach histo and separate QTimers to do Modified() and Update() to each canvas?
Should I just add the Mod+Upd commands in the QMainCanvas class and let it do itself?
How often do you think it can be done? Now I’m refreshing at 1Hz. If I go faster, the data is lost. (of course my code is not the best)
It should be possible. When running, if I drag the legend around, the update is going lightning fast. This means that ROOT itself is handling the update in a better way as me. This is nice, but how do I get closer to that?
many thanks for any input!
You can easily compile and test my code from here.
Only needs Qt5.7, Root5.
When you run the vmm-mon application, it will wait for data. This can be sent using the app inside folder debugServerApp, which can also be compiled with Qt5.7.
The problem is most probably due to the event handling fired by a timer. I think on a native ROOT GUI application, you could expect a faster update…
And about the way of updating the pad/canvas, I think it really depends on the way their content is updated. But I’ll let Olivier @couet comment on this particular point.
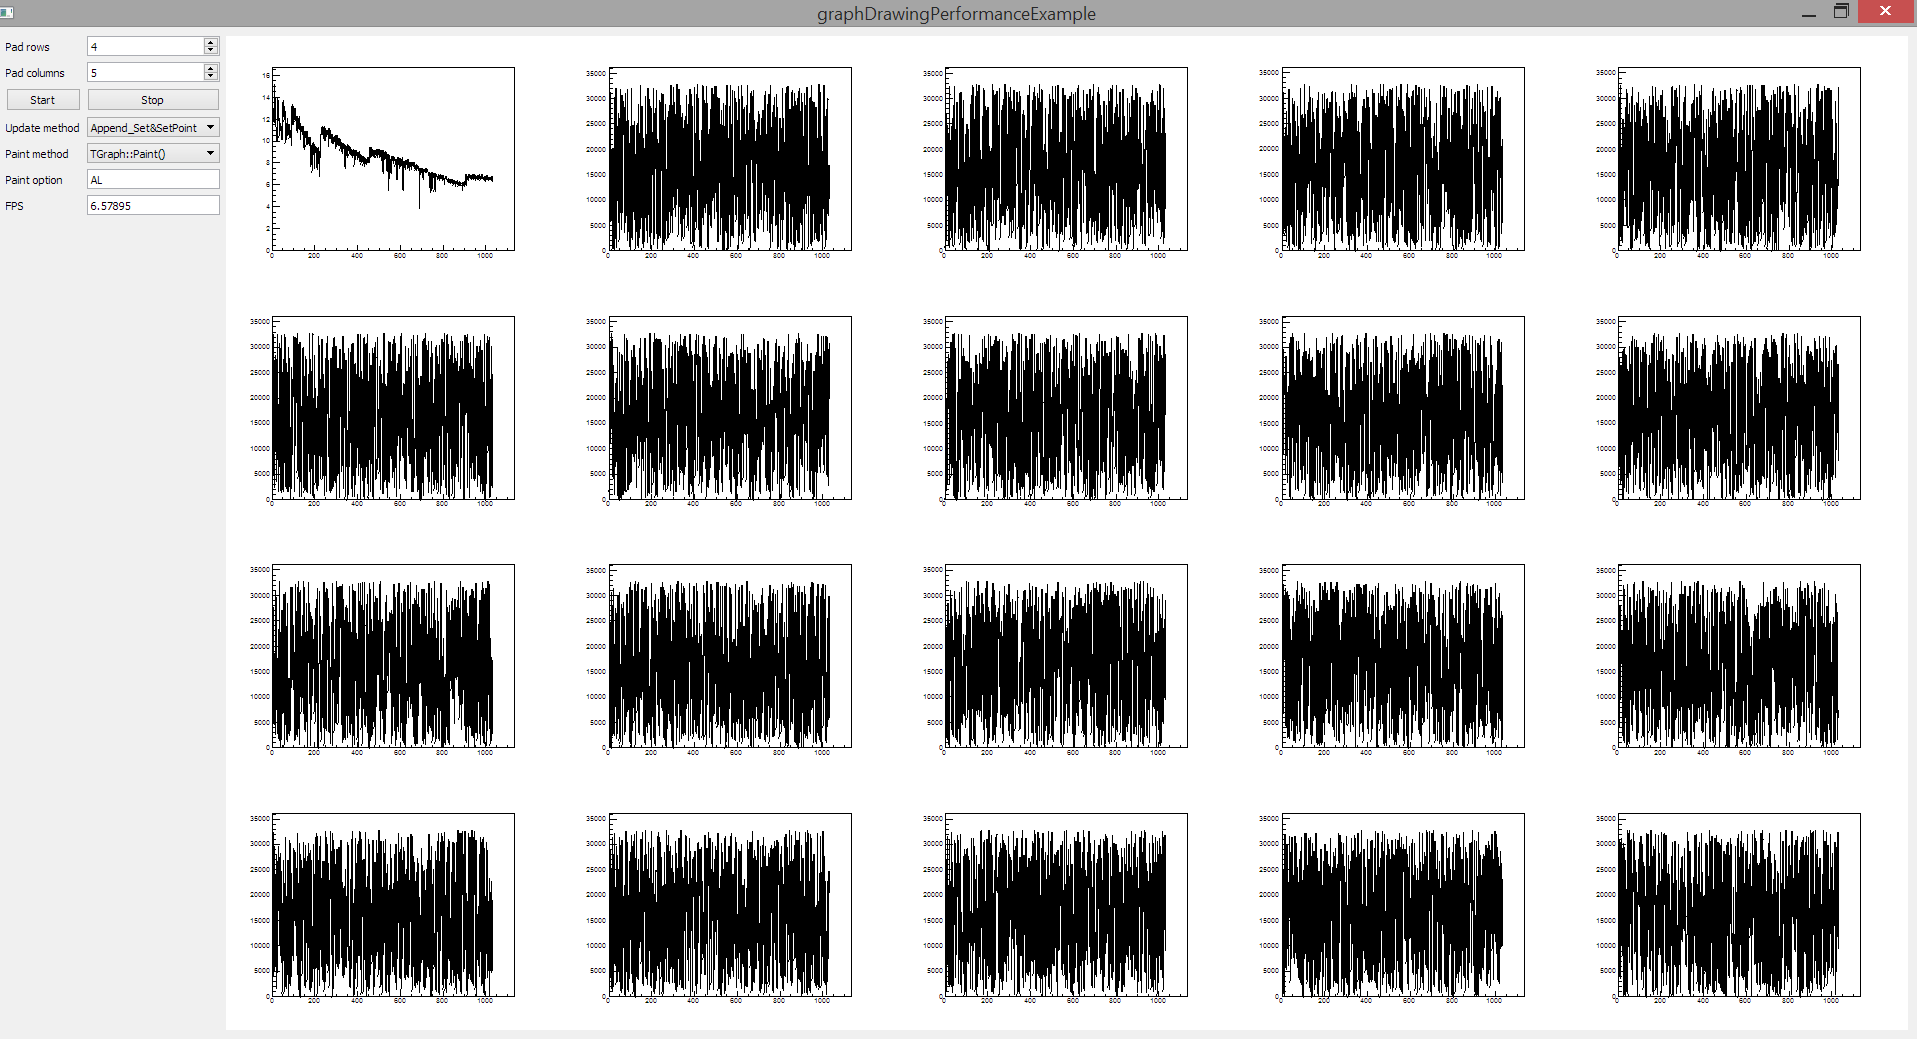
In case of relevance providing some insight to refresh rates (didn’t have access rights to check the linked code so don’t know similarity with this), there’s a code for a simple graph drawing performance tester here (uses customized ROOT5 and Qt 5). It draws a user definable M*N grid of TGraphs (which internally use histograms) with various settings and shows FPS. Below is a screenshot; the main numbers are that drawing 20 graphs each in their own pad with about 1000 points in each has FPS around 6 with ordinary paint-method using a debug build (the top left graph shows FPS-graph as function of graph point count). I would expect the number to be considerably higher in release-build.
[edit 2017-02-27: added clarification about the test code]
@tc3t, the file you point to is just a .cpp. I’m not sure how to compile it.
I tried to put it in a Qt project, which seemed to overcome the gcc/g++ errors, but still not compiling because it doesn’t find the TQtWidget.
And the TQtWidget, I haven’t seen much lately.
Is it still relevant?
thanks.
I don’t need it for my code. But it is in the example by tc3t.
Anyway. I will look into the code, sans compilation, and hopefully return here with more.
Sorry for the obsolete coding: the example uses QtROOT (deprecated in ROOT) so that’s why it uses TQtWidget. That would probably be quite easy to replace by QRootCanvas, but there is also a couple other things (DrawOnPad() and InsertPointAt()) why it won’t compile without further tweaks. If really needed, it might be a tolerable task to adjust it to get it running e.g. by temporarily copying it to main file of your existing project, but it was mainly intended to show an example of refresh rates.
The example has now been updated so that it should build with ROOT5 (at least works for me on Windows and ROOT 5.34.36) and there’s also a .pro file for easy building, see here. Note that it expects to have canvas.h & canvas.cpp in the same folder where the .pro file is (i.e. the files from the simple_canvas-example).