When I draw a histogram, I normalize it and then draw the graph, there is always a vertical line on the left side of the graph, I would like to ask why? And is there any way to remove it?
Can you provide an example reproducing this behavior ?
#include <iostream>
#include <fstream>
#include <stdlib.h>
#include <string>
#include <TH1D.h>
#include <TH2D.h>
#include <TGraph.h>
#include <TCanvas.h>
#include <TAxis.h>
#include <TMath.h>
#include <TStyle.h>
#include <TGraphAsymmErrors.h>
#include <TGraphErrors.h>
#include <vector>
#include <TLegend.h>
#include <math.h>
#include <set>
#include <TF1.h>
using namespace std;
using namespace TMath;


void aa(){

  const int NBIN =10;
  double xbins[NBIN+1], xbinCenter[NBIN];
  for(int i=0; i<=NBIN; i++){
    xbins[i]= pow(10, -3+double(i)*0.2);
    if(i!=0) {
      xbinCenter[i-1] = Sqrt(xbins[i]*xbins[i-1]);
    }
  }
  TH1D *h  = new TH1D("h", "h",  NBIN, xbins);
  TH1D *h1 = new TH1D("h1","h1", NBIN, xbins);
  for(int i=1; i<=NBIN; i++){
    h->SetBinContent(i, 0.001*i);
    h1->SetBinContent(i, 0.002*i);
  }
  TCanvas *c = new TCanvas("c", "", 900,750);
  c->cd();
  c->SetLogx();
  c->SetLogy();
  h->SetLineColor(2);
  h1->SetLineColor(2);
  h->Draw();
  h1->Draw("same");
  c->Print("aa.png");
}
This happens only when two histograms are drawn at the same time and the value of SetBinContent is less than 1. Please ask how to solve this trouble, thank you very much!

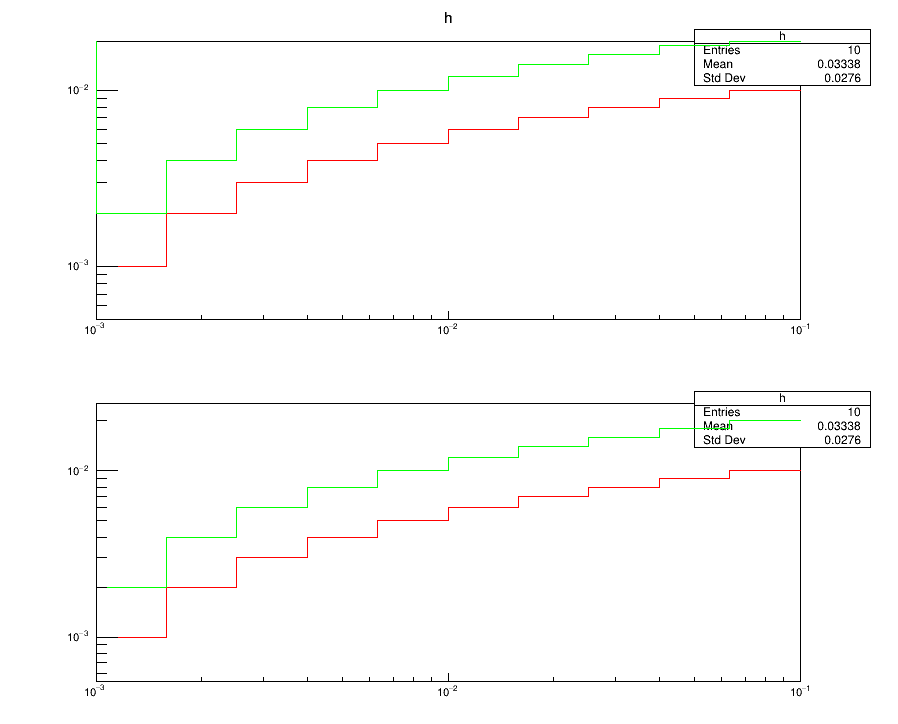
I think it’s about the vertical red line on the y-axis, which in fact comes from the histogram h1 (see below, in green), and I’d say is an artifact from superposing histograms with different heights. One way to avoid it would be using a THStack instead of Drawing on the same canvas:
void aa(){

  const int NBIN =10;
  double xbins[NBIN+1], xbinCenter[NBIN];
  for(int i=0; i<=NBIN; i++){
    xbins[i]= pow(10, -3+double(i)*0.2);
    if(i!=0) {
      xbinCenter[i-1] = Sqrt(xbins[i]*xbins[i-1]);
    }
  }
  TH1D *h  = new TH1D("h", "h",  NBIN, xbins);
  TH1D *h1 = new TH1D("h1","h1", NBIN, xbins);
  for(int i=1; i<=NBIN; i++){
    h->SetBinContent(i, 0.001*i);
    h1->SetBinContent(i, 0.002*i);
  }
  h->SetLineColor(2);
  h1->SetLineColor(3);
  THStack *hs=new THStack();
  hs->Add(h);
  hs->Add(h1);

  TCanvas *c = new TCanvas("c", "", 900,750);
  c->Divide(1,2);
  c->cd(1);
  gPad->SetLogx();
  gPad->SetLogy();
  h->Draw();
  h1->Draw("same");
  c->cd(2);
  gPad->SetLogx();
  gPad->SetLogy();
  hs->Draw("nostack");
}
Ok I see now… without using stacks you can also do:
  h->Draw();
  h1->Draw("same");
  gPad->RedrawAxis();
Hi, I’m very sorry to trouble you again. I would like to ask under what circumstances this problem occurs and how to avoid it. The above situation occurs again when I draw some pictures, and the two methods you mentioned do not work.
#include <iostream>
#include <fstream>
#include <stdlib.h>
#include <string>
#include <TH1D.h>
#include <TH2D.h>
#include <TGraph.h>
#include <TCanvas.h>
#include <TAxis.h>
#include <TMath.h>
#include <TStyle.h>
#include <TGraphAsymmErrors.h>
#include <TGraphErrors.h>
#include <vector>
#include <TLegend.h>
#include <math.h>
#include <set>
#include <TF1.h>
using namespace std;
using namespace TMath;

void aa(){

  const int NBIN =10;
  double xbins[NBIN+1], xbinCenter[NBIN];
  for(int i=0; i<=NBIN; i++){
    xbins[i]= pow(10, -3.0+double(i)*0.2);
    if(i!=0) {
      xbinCenter[i-1] = Sqrt(xbins[i]*xbins[i-1]);
    }
  }

  const int Number =3;
  TH1D *h[Number];
  for(int i=0; i<Number; i++){
    h[i]= new TH1D(Form("h[%i]",i), Form("h[%i]",i),NBIN, xbins);
    for(int j=1; j<=NBIN; j++){
      h[i]->SetBinContent(j,  0.000001*(i+1)*j);
    }
  }
//  for(int i=0; i<Number; i++){
//    h[i]->Scale(1.0/h[i]->GetEntries());
//  }

  const int color[Number]  = {2,3,4};
  const int marker[Number] = {21,22,23};
  const double markerSize = 0.35;
  const int linestyle[Number] = {1, 5,7};
  string title[3] = {"a", "b", "c"};
  gStyle->SetOptStat(0);
  TH2D *h1 = new TH2D("h1", "", 10, 9e-4,1e-1, 10,9e-6, 3e-5);

  THStack *hs = new THStack();
  TCanvas *c = new TCanvas("c", "", 900,750);
  c->cd();
  c->SetLogx();
  c->SetLogy();
  c->SetFillColor(0);
  c->SetBorderMode(0);
  c->SetBorderSize(2);
  c->SetFrameBorderMode(0);
  c->SetFrameLineWidth(3);
  c->SetFrameBorderMode(0);

  h1->GetXaxis()->SetTitle("X");
  h1->GetYaxis()->SetTitle("Y");
  h1->GetXaxis()->SetLabelFont(42);
  h1->GetXaxis()->SetTitleOffset(1.15);
  h1->GetXaxis()->SetTitleFont(42);
  h1->GetYaxis()->SetLabelFont(42);
  h1->GetYaxis()->SetLabelSize(0.04);
  h1->GetYaxis()->SetTitleSize(0.04);
  h1->GetYaxis()->SetTitleOffset(1.0);
  h1->Draw();
  TLegend *l = new TLegend(0.7, 0.7, 0.89, 0.89);
  l->SetBorderSize(1);
  l->SetLineColor(0);
  l->SetLineStyle(1);
  l->SetLineWidth(1);
  l->SetFillColor(0);

  for(int i=0; i<3; i++){
    h[i]->SetLineColor(color[i]);
    h[i]->SetLineWidth(3);
    h[i]->SetLineStyle(linestyle[i]);
    //h[i]->Draw("same");
    hs->Add(h[i]);
    l->AddEntry(h[i], title[i].c_str(),"pl");
  }
  hs->Draw("nostack");
  TText *ttt = new TText(2e-3,2e-5,"(a)");
  ttt->SetTextSize(0.07);
  ttt->Draw("same");

  l->Draw("same");
//  gPad->RedrawAxis();
  c->Print("aa.png");
}
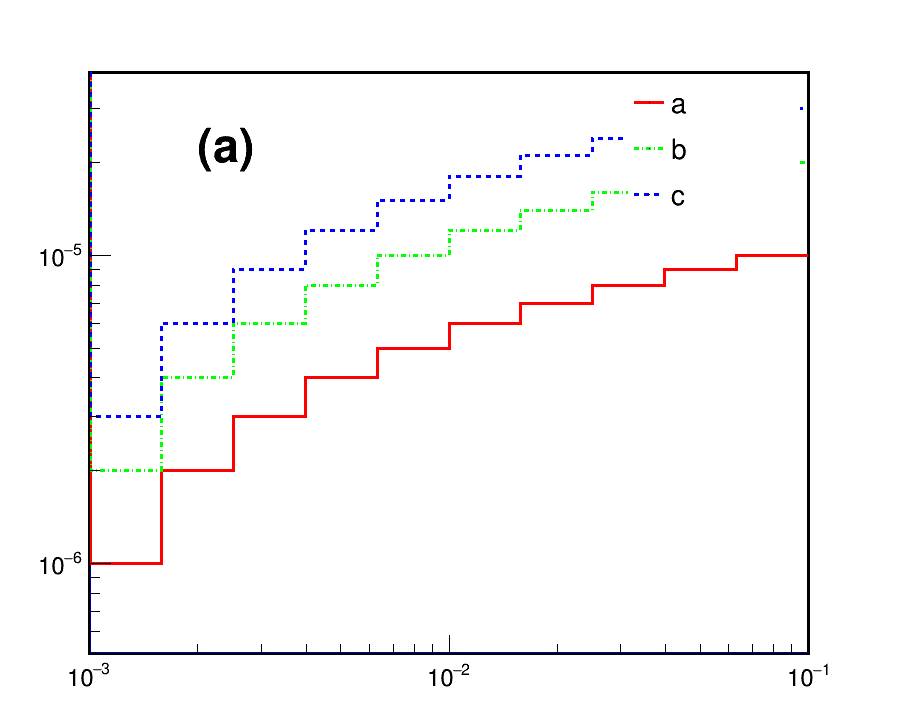
Thank you very much for the solution provided last time, but I have the same problem when I use the above code to draw a picture, how can I solve it in this case? thanks.
Try drawing with the option “L” (you can also add P if you define a marker for each histo), i.e.:
hs->Add(h[i],"L");
or
hs->Draw("nostack,L");
To keep the “column” style, you can do:
hs->Draw("nostack,][");
where “][” means that “the first and last vertical lines of the histogram are not drawn”.