Dear experts,
I am trying to fit the sum of a double sided Crystal Ball (for signal) and an Exponential (for background) to a weighted RooDataset, via an unbinned maximum likelihood fit.
I am performing the fit in a sub range of the master variable.
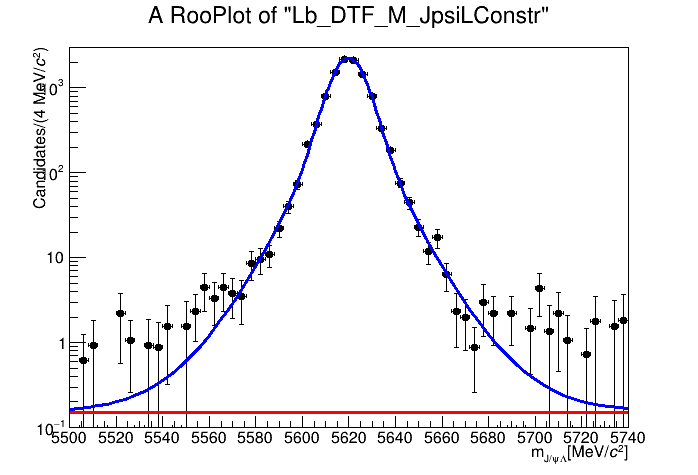
The fit goes fine, and the fitted values of the yields make sense. But when I attempt to plot the results, the background shape is a lot higher than the total fit. It looks like the normalization of the background is wrong. This happens even though I pass the SumCoefRange option in the fitTo command. I don’t understand why the normalization is off only for one of the fit components.
I am attaching my runnable test code, input workspace, and a screenshot of the fit output.
I would appreciate any advice on this issue.
Thanks,
Arvind.
myWS.root (155.5 KB) testScript.C (2.5 KB) 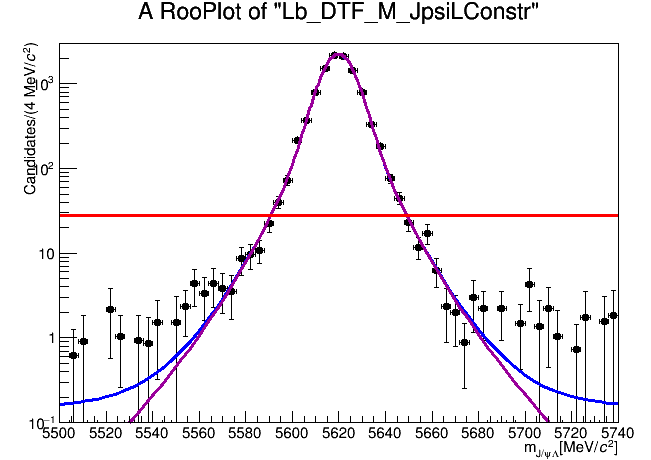
Hi Arvind,
thank you for your thourough report and reproducer! @StephanH is probably the best person to help here!
Cheers,
Enrico
Hello Arvind,
That’s because RooFit normalises the background PDF to match the number of data events. That’s obviously wrong as you can see in the plot.
What you have to do is to use the Components notation as follows:
  sumPdf->plotOn(simframe_Run1);
  sumPdf->plotOn(simframe_Run1,LineColor(kMagenta+2), RooFit::Components("LB_Run1"));
  sumPdf->plotOn(simframe_Run1,LineColor(kRed), RooFit::Components("mcbkg_Run1"));
So you are always plotting the sumPdf, and the total sum is normalised to the data. Then, you select only the named components (you can also select multiple using commas), but the normalisation is still with reference to the total sum.
For reference, this is how I got the sumPdf:
RooAbsPdf* sumPdf = static_cast<RooAbsPdf*>(
     w.factory("SUM::mcFit_Run1(mcnsig_Run1*Lb_Run1, mcnbkg_Run1*mcbkg_Run1)"));
This is where all this is shown in a bit more detail:
https://root.cern.ch/doc/master/rf205__compplot_8C.html
Dear Stephan,
Thank you! I would have never caught that mistake. Lesson learnt for the future.
Arvind.