Hi,
In RooFit, I’ve created a composite, conditional PDF, and I’m having some trouble extracting some of the parameters after I use it to do a fit. The PDF is a RooProdPdf of 1.) a RooAddPdf of 3 RooGaussians and 2.) a conditional RooGaussian. I would like my fit to return the coefficients of the RooAddPdf, but the fit seems insensitive to these parameters. In particular, HESSE to fails with the following output:
MIGRAD MINIMIZATION HAS CONVERGED.
MIGRAD WILL VERIFY CONVERGENCE AND ERROR MATRIX.
MINUIT WARNING IN HESSE
============== Second derivative enters zero, param 2
MINUIT WARNING IN HESSE
============== Second derivative zero for parameter2
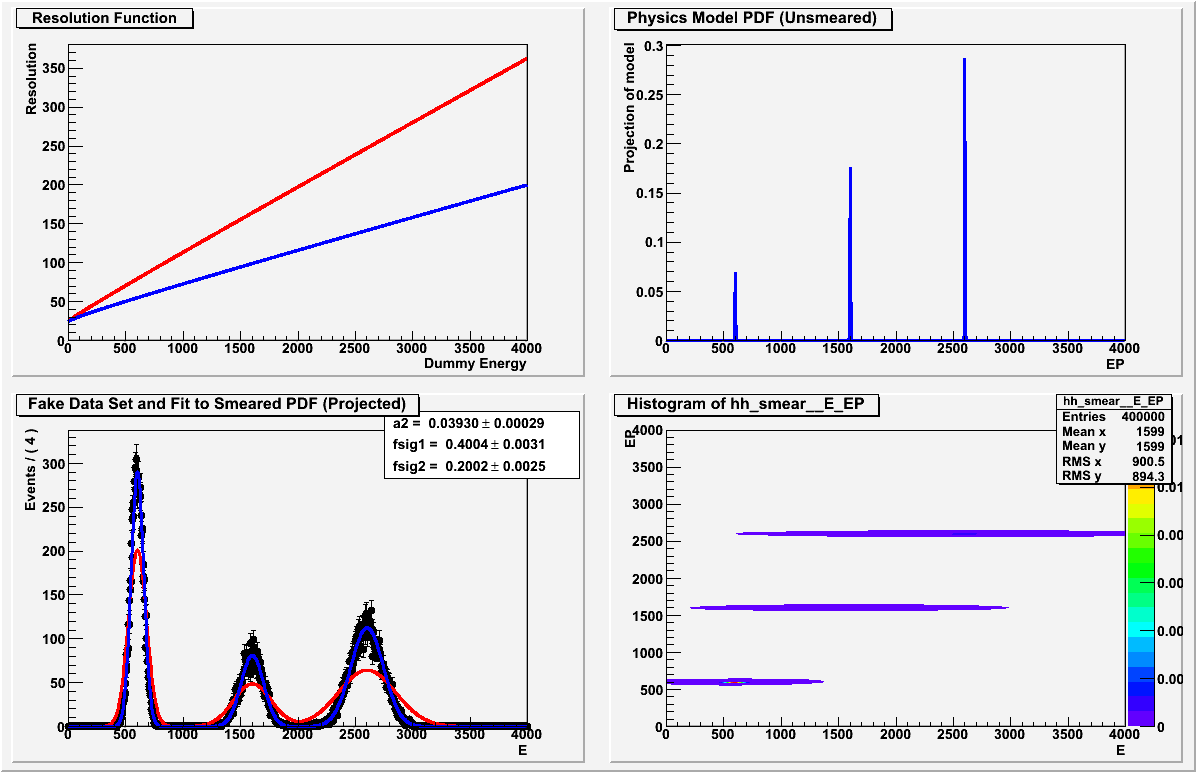
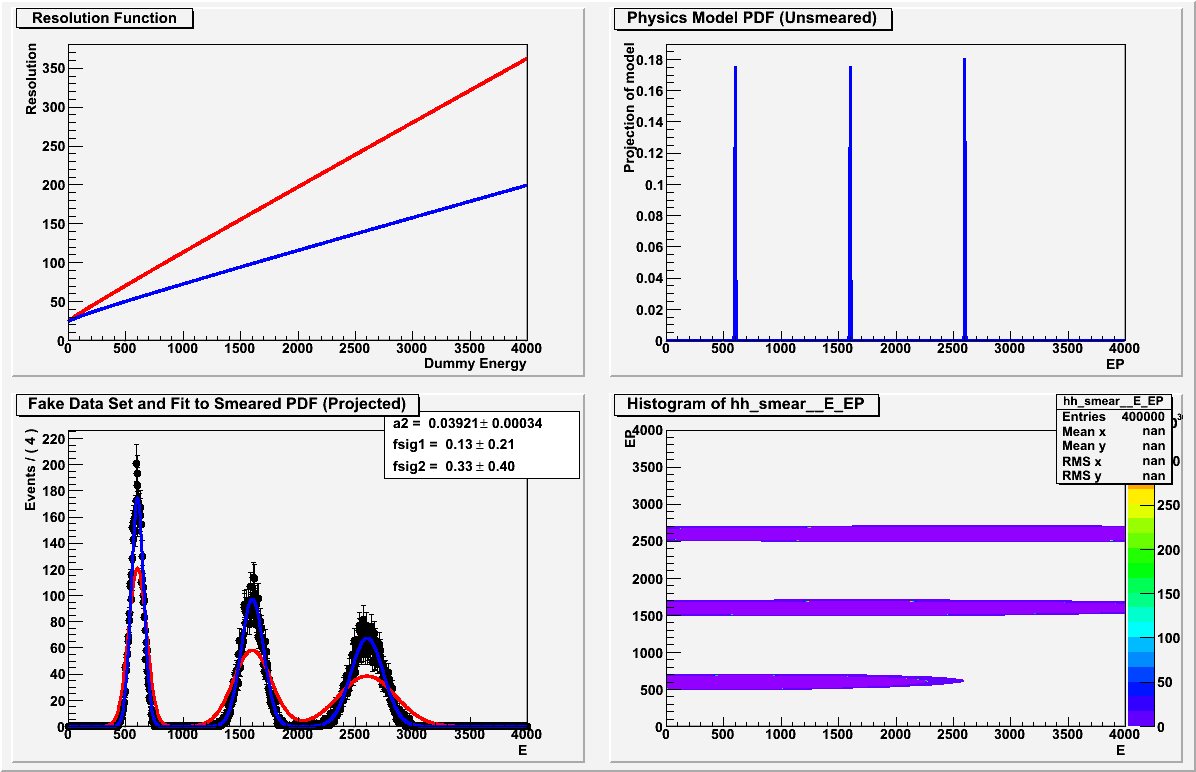
MNHESS FAILS AND WILL RETURN DIAGONAL MATRIX. The larger story is that I’m trying to use RooFit to take an input PDF, which is a function of energy, and smear it with an energy-resolution that is also a function of energy. So for example if my input PDF is a sum of 3 delta functions at different energies, E1, E2, E3, I would like my procedure to return a sum of 3 gaussians centered on E1, E2, E3, with widths sig(E=E1), sig(E=E2), sig(E=E3), where sig(E) is my energy-dependant resolution.
To achieve this in my script, I set up a RooGaussian over E with mean EP and width sig(EP), where EP is a dummy variable, since I need a Gaussian that is normalized at any given energy, E. This is the conditional PDF that then goes into the product with my input PDF of 3 narrow gaussians. Then I make by hand a RooDataSet with columns for E and EP, where EP takes one of 3 values, as in a sum of 3 delta functions, and E is sampled from a gaussian about one of those 3 values, each gaussian having a width according to my function sig(E).
When I plot the resulting fitted, “smeared” PDF, it matches the data set, but the values returned for the fractional normalization of each gaussian seem arbitrary and are clearly not the fractions shown in the plot or in the data; see the lower left plot in the attached image. I’ve checked that the fractional components are indeed parameters of the smear PDF, so it’s not clear to me why the fit should be insensitive to them.
I’ve attached a running version of my code, and could use any comments on the problem or my procedure in general.
– Simon
resSmearTest6_3_A_post.C (4.65 KB)