Dear ROOT Users,
I have been trying to normalize the histogram to the number of events.
TFile*f =new TFile("example.root");
TTree*tree;
f->GetObject("tree",tree);
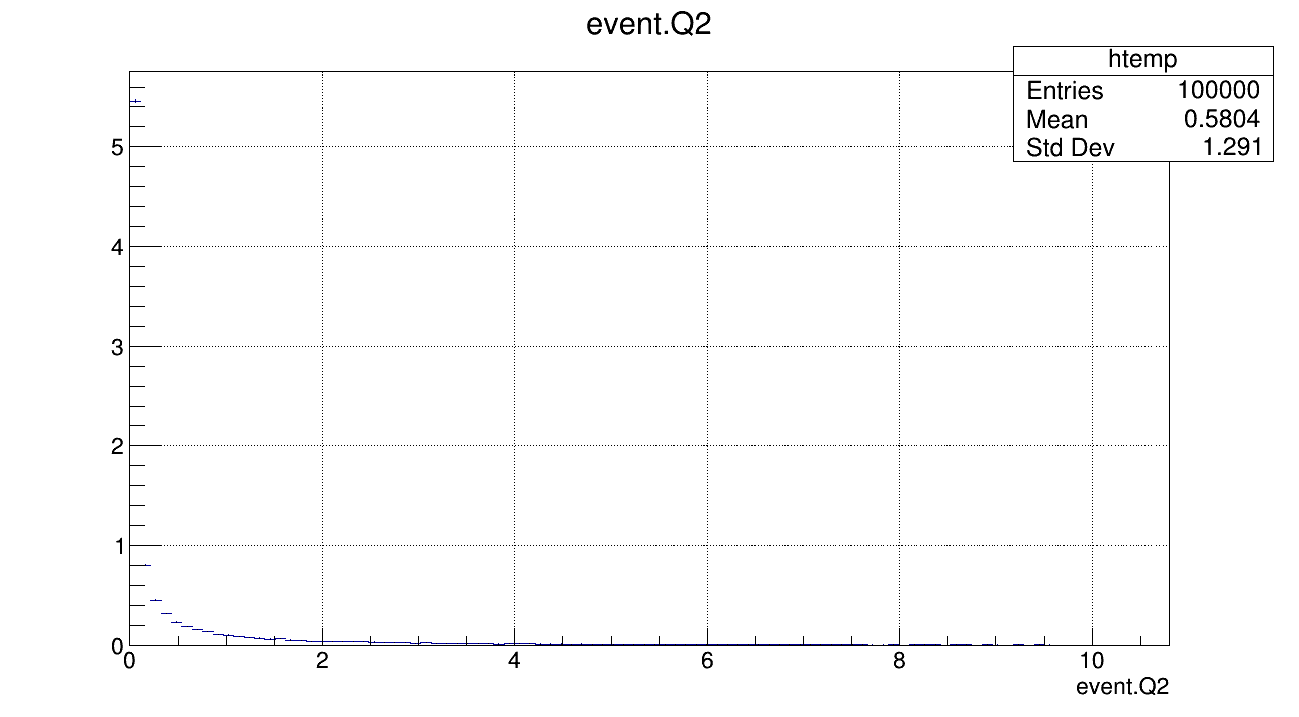
tree->Draw("event.Q2")
Here I want to normalize the event.Q2 histogram.
KIndly suggest some ways. I have used the following :
Please read tips for efficient and successful posting and posting code
ROOT Version: 6.08/02Platform: UbuntuCompiler: Not Provided
tree->Draw("event.Q2");
TH1 *htemp = (TH1*)gPad->GetPrimitive("htemp"); // 1D
htemp->Scale(1.0 / htemp->Integral(), "width");
gPad->Modified(); gPad->Update();
Thank you so much for your help.
Try with: tree->Draw("event.Q2", "", "HIST");
This is not working, I am attaching the rest of the code I am using to give a better idea.
TFile*f =new TFile("example.root");
TTree*tree;
f->GetObject("tree",tree);
 tree->Draw("event.Q2", "", "HIST");
TH1F *htemp = (TH1F*)gPad->GetPrimitive("htemp"); // 1D
htemp->Scale(1.0 / htemp->Integral(), "width");
gPad->Modified();
gPad->Update();
//second graph
  c1->cd(2);
   const Int_t n1 = 8;
   Double_t px1[] = {0.05, 2.5, 4.0, 6.3,10.0, 15.8,25.0,47.3};
   Double_t py1[] = {73.1,37.3,31.7,21.8,13.3,7.53,3.43,0.60};
   Double_t ex1[] = {0,0,0,0,0,0,0,0};
   Double_t ey1[] = {6.4,3.6,3.0,2.1,1.3,0.72,0.33,0.06};
   TGraphErrors *gr1 = new TGraphErrors(n1,px1,py1,ex1,ey1);
   gr1->SetMarkerColor(kBlue);
   gr1->SetMarkerStyle(21);
    mg->Add(gr1);
   mg->Draw("pz");
}
Sorry for all the trouble
Hi,"same" among the drawing options.
Cheers,
Thanks for your reply.
Unfortunately, I also tried this but then only the experimental data is shown in the histogram.
Can you please share example.root so our graphics expert @couet can take a look?
Cheers,
couet
February 15, 2021, 9:53am
9
eguiraud:
@couet can take a look?
Sure, post the ROOT fille @eguiraud requested.
Kindly find the attached example. root file in the folder.
Thank you in advance for your help.
https://drive.google.com/drive/folders/1QnsOp8m5qsWgu_LeU3A7Q6Hd5RA1hVZi?usp=sharing
couet
February 15, 2021, 11:51am
11
In your macro mg is not defined.
Sure, I forgot to write the whole code above.
{

//first graph
TCanvas *c1 = new TCanvas("c1","multigraph",700,500);
   c1->SetGrid();

   TMultiGraph *mg = new TMultiGraph();

   // create first graph
  c1->cd(1);
TFile*f =new TFile("example.root");
TTree*tree;
f->GetObject("tree",tree);
 tree->Draw("event.Q2", "", "HIST");
TH1F *htemp = (TH1F*)gPad->GetPrimitive("htemp"); // 1D
htemp->Scale(1.0 / htemp->Integral(), "width");
gPad->Modified();
gPad->Update();
//second graph
  c1->cd(2);
   const Int_t n1 = 8;
   Double_t px1[] = {0.05, 2.5, 4.0, 6.3,10.0, 15.8,25.0,47.3};
   Double_t py1[] = {73.1,37.3,31.7,21.8,13.3,7.53,3.43,0.60};
   Double_t ex1[] = {0,0,0,0,0,0,0,0};
   Double_t ey1[] = {6.4,3.6,3.0,2.1,1.3,0.72,0.33,0.06};
   TGraphErrors *gr1 = new TGraphErrors(n1,px1,py1,ex1,ey1);
   gr1->SetMarkerColor(kBlue);
   gr1->SetMarkerStyle(21);
    mg->Add(gr1);
    mg->Draw();
}
TCanvas *c1 = new TCanvas(...);
c1->Divide(1, 2); // two pads
// ...
mg->Draw("AP");
couet
February 15, 2021, 12:35pm
14
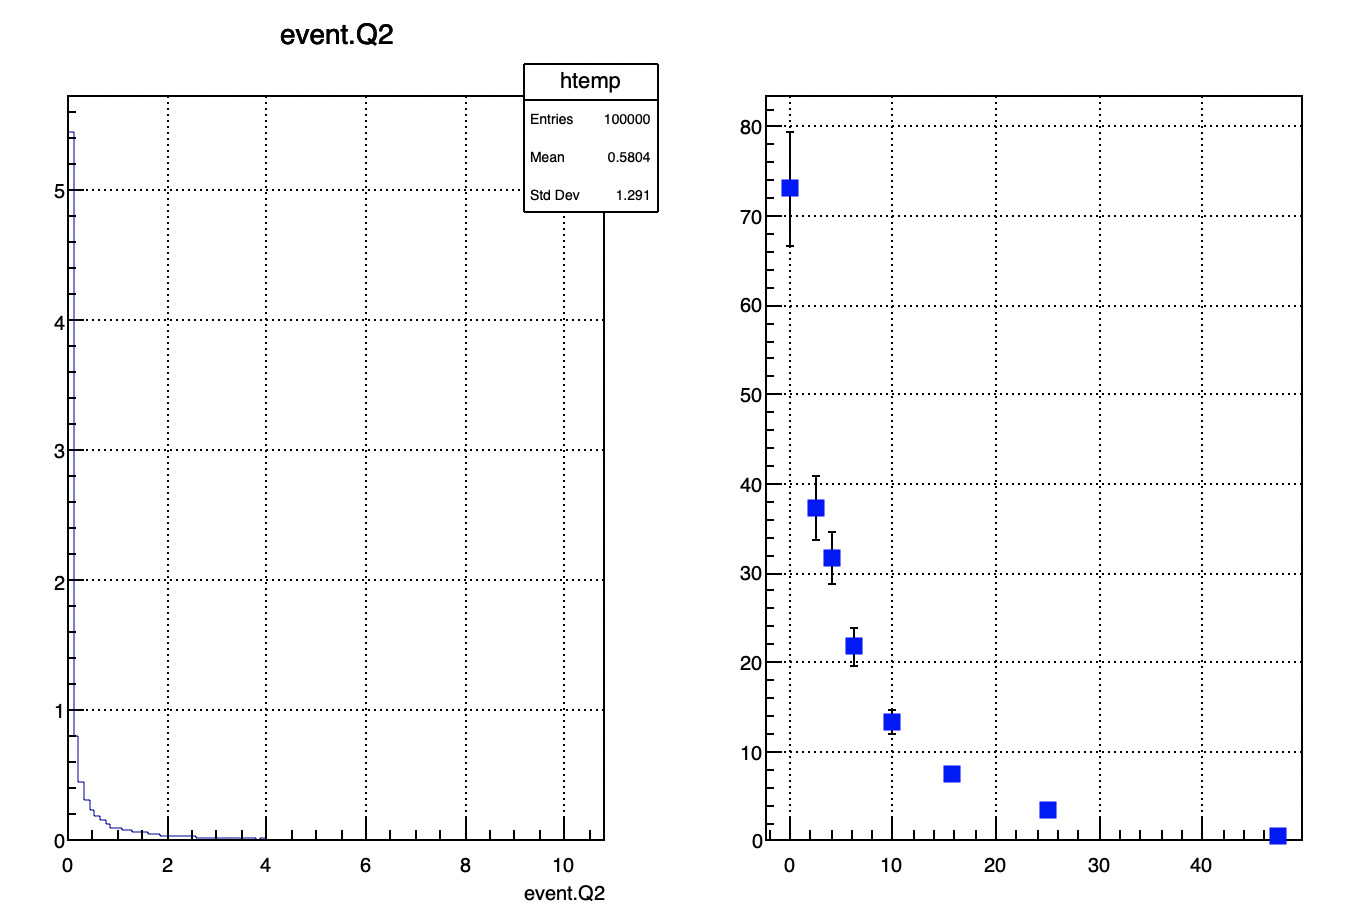
{
   TCanvas *c1 = new TCanvas("c1","multigraph",700,500);
   c1->Divide(2,1);

   TMultiGraph *mg = new TMultiGraph();

   c1->cd(1)->SetGrid();
   TFile*f =new TFile("example.root");
   TTree*tree;
   f->GetObject("tree",tree);
   tree->Draw("event.Q2", "", "HIST");
   TH1F *htemp = (TH1F*)gPad->GetPrimitive("htemp"); // 1D
   htemp->Scale(1.0 / htemp->Integral(), "width");
   gPad->Modified();
   gPad->Update();

   c1->cd(2)->SetGrid();
   const Int_t n1 = 8;
   Double_t px1[] = {0.05, 2.5, 4.0, 6.3,10.0, 15.8,25.0,47.3};
   Double_t py1[] = {73.1,37.3,31.7,21.8,13.3,7.53,3.43,0.60};
   Double_t ex1[] = {0,0,0,0,0,0,0,0};
   Double_t ey1[] = {6.4,3.6,3.0,2.1,1.3,0.72,0.33,0.06};
   TGraphErrors *gr1 = new TGraphErrors(n1,px1,py1,ex1,ey1);
   gr1->SetMarkerColor(kBlue);
   gr1->SetMarkerStyle(21);
   mg->Add(gr1);
   mg->Draw("ap");
}
Thank you for your reply.
Actually, I am looking for plotting these two plots on the same graphs. Is there any way to do that?
couet
February 15, 2021, 1:16pm
17
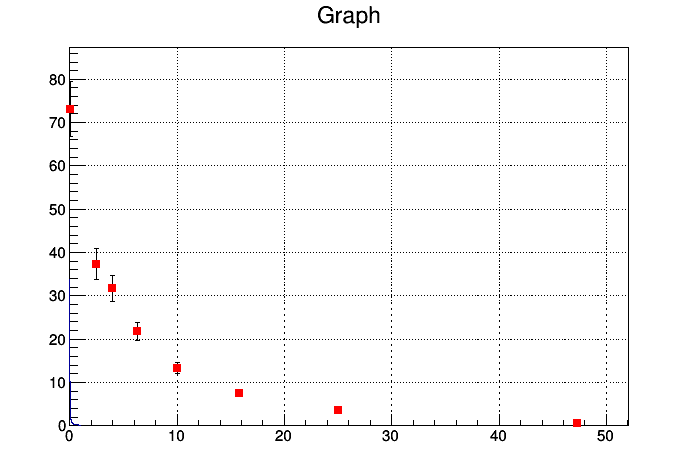
The graph has a much wider range. You should plot it first
{

   const Int_t n1 = 8;
   Double_t px1[] = {0.05, 2.5, 4.0, 6.3,10.0, 15.8,25.0,47.3};
   Double_t py1[] = {73.1,37.3,31.7,21.8,13.3,7.53,3.43,0.60};
   Double_t ex1[] = {0,0,0,0,0,0,0,0};
   Double_t ey1[] = {6.4,3.6,3.0,2.1,1.3,0.72,0.33,0.06};
   TGraphErrors *gr1 = new TGraphErrors(n1,px1,py1,ex1,ey1);
   gr1->SetMarkerColor(kBlue);
   gr1->SetMarkerStyle(21);
   gr1->Draw("AP");

   gPad->Modified(); gPad->Update(); // see @Wile_E_Coyote reply

   TFile*f =new TFile("example.root");
   TTree*tree;
   f->GetObject("tree",tree);
   tree->Draw("event.Q2", "", "HIST SAME");
}
@couet The "HIST SAME" options misbehave in TTree::Draw here. The automatically created "htemp" histogram has “xmin = 0” and “xmax = 1” (without "SAME" you would get “xmax = 10.8” here).
In order to overcome it here, one needs to use (note: when "SAME" is present, the "htemp" x-axis limits will then be inherited from the pad):gr1->Draw("AP"); gPad->Modified(); gPad->Update();
Thank you so much for your help. I am getting the output. I think due to the large variation in the data, one of the plots is around zero. Anyway, this is of great help.