Hey guys, I am trying to fit a shape onto a RooHist of data however I am having some issues with fitting due my limited understanding of the parameters for the normalised RooRealVars I am creating. Here is my code for the Gaussian and Exponential shapes, along with their normalised pdfs:
GNP = getGaussNormParams(N)

    gaussMean = ROOT.RooRealVar("gaussMean","gaussMean", GAUSS_PARAMS[0], GAUSS_PARAMS[1], GAUSS_PARAMS[2])
    gaussWidth = ROOT.RooRealVar("gaussWidth","gaussWidth", GAUSS_PARAMS[3], GAUSS_PARAMS[4], GAUSS_PARAMS[5])
    gaussNorm = ROOT.RooRealVar("gaussNorm","gaussNorm", GNP[0], GNP[1], GNP[2])

    gauss = ROOT.RooGaussian("gauss","gauss",var, gaussMean, gaussWidth)


    if(FIT_EXPO):

        ENP = getExpoNormParams(N)

        e = ROOT.RooRealVar("e","e",EXPONENTIAL_PARAMS[0], EXPONENTIAL_PARAMS[1], EXPONENTIAL_PARAMS[2])
        bkgNorm = ROOT.RooRealVar("bkgNorm","bkgNorm", ENP[0], ENP[1], ENP[2])

        bkg = ROOT.RooExponential("bkg","bkg", var, e)
Here are the lists of parameters and the functions used to get the normalisation parameters. “N” corresponds to the entries of the tree:
GAUSS_PARAMS = [2469,   #Gauss Mean
                2460,   #Gauss Mean - Min
                2478,   #Gauss Mean - Max
                2,     #Gauss Width
                1,      #Gauss Width - Min
                7]     #Gauss Width - Max

EXPONENTIAL_PARAMS = [-0.07, #Exponent
                      -0.08,    #Exponent - Min
                      -0.001]     #Exponent - Max

def getGaussNormParams(N):
    gNormList = [N ,
                N/500 * 2,
                 2*N]

    return gNormList

def getExpoNormParams(N):
    eNormList = [N * 0.5,
                 N/1000,
                 N * 2]

    return eNormList
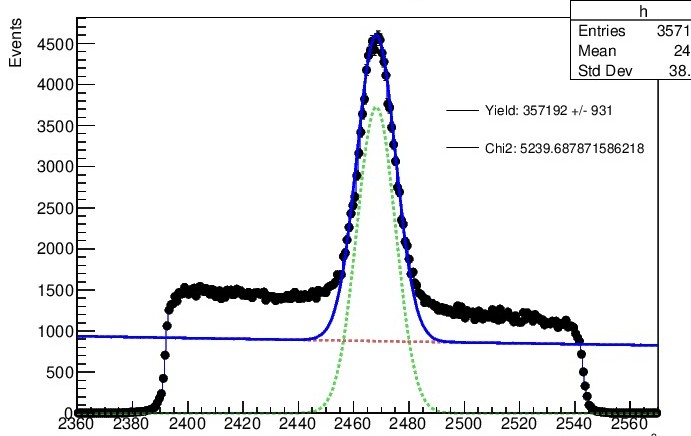
I am following a tutorial for this and this is where I get these things from. But can someone tell me what exactly these normalised things are/what they mean and how can I mess around with them for my shape to fit my data? A picture of where I am right now is attached. How can I get this exponential line to fit my background? what am I doing wrong? Any help is appreciated
Regards,
Diyon