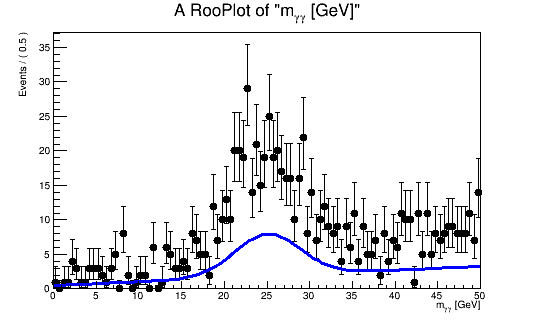
I’m attempting to produce a dataset with multiple categories, and perform a simultaneous fit (using a RooSimultaneous) to that dataset. So far, my code for this part appears to work fine. Then for each category I create a RooFrame for the variable I’m fitting, plot that category of the dataset with the plotOn method, and then plot the corresponding component of the RooSimultaneous pdf. The shape appears to be fitted correctly, but the normalisation does not behave as I would expect: the pdf is consistently below the dataset (see the attached .png file for an example). As I understand it, fitting with the Extended(true) option should result in the fit process accounting for the scale of the pdf as well as the shape, but this doesn’t seem to be the case.
The actual study i’m working on uses a rather complex pdf and with many RooFormulaVars and values of some pdf elements being read in from a file, making the macro somewhat unreadable. But I’ve produced a much simpler example (also attached, as “minimalexample.C” - ) which displays exactly the same behaviour. Could anybody help me figure out how to display these fitted pdfs alongside the data with correct normalisation?
cheers
Chris
minimalexample.C (2.69 KB)