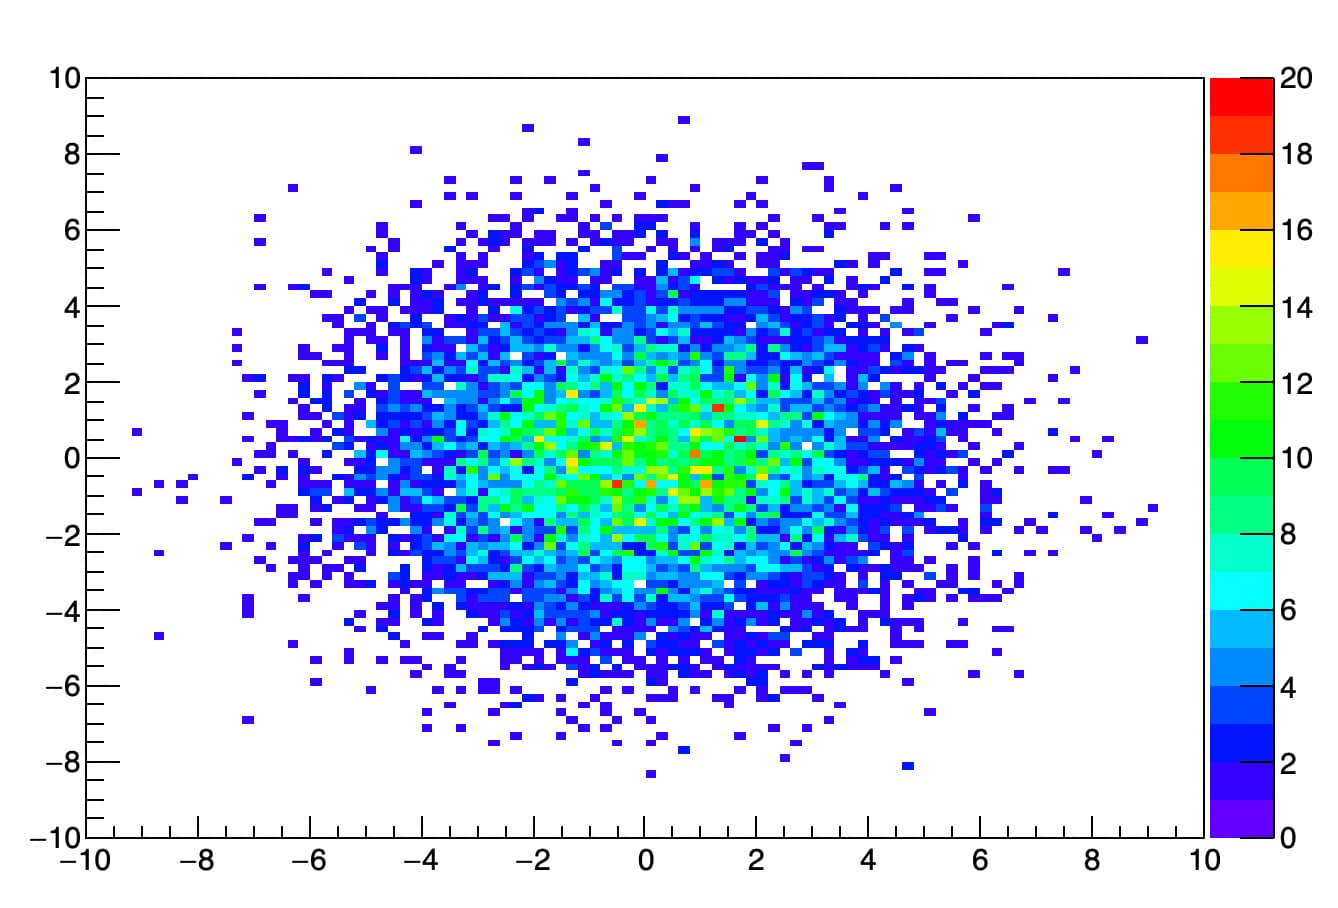
Weird… that’s python but that should not be the problem. You see the scatter plot, so the Draw command is working. Your script cannot be run because the data are missing. Can you post a running script showing the problem ?
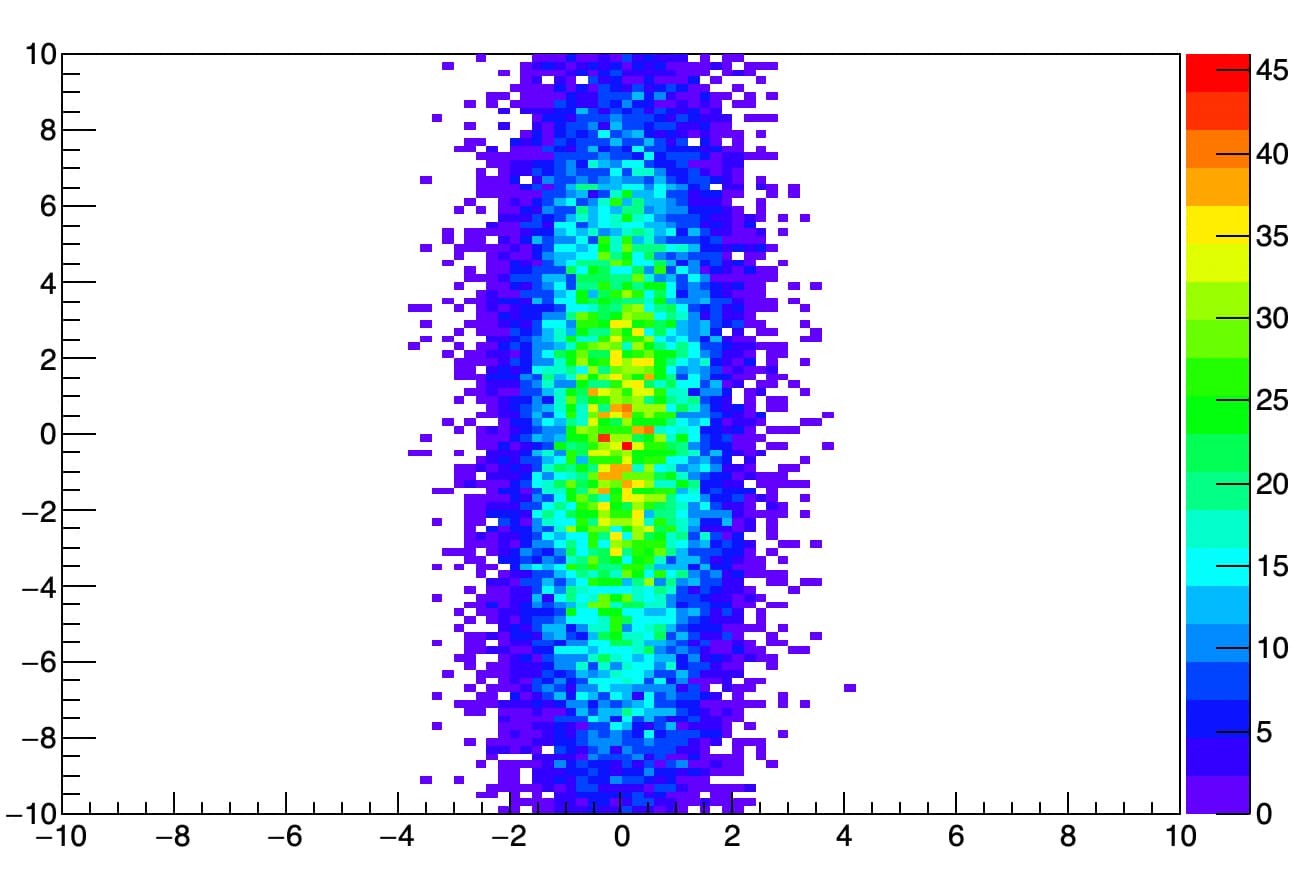
Your script as it is doesn’t give me any output. I made a C++ version of it which shows the color plot.
{
   auto c1 = new TCanvas("c1");
   auto f = new TFile("2dhist.root", "RECREATE");

   gStyle->SetOptStat(0);
   gStyle->SetPalette(1);

   auto histo = new TH2F("","", 100, -10, 10 , 100, -10, 10);

   float px, py;
   for (Int_t i = 0; i < 25000; i++) {
      gRandom->Rannor(px,py);
      histo->Fill(px,5*py);
   }

   histo->Draw("colz");
   histo->Write()
}
When you save an histogram in a ROOT file you save the histogram data only not the drawing option. The Drawing option is specified when you Draw the histogram. In the browser you have a menu choice where you can set the drawing option.