I recently upgraded my Mac OSX machine from Root 4.04.02 to 5.14.00. I’ve noticed something odd about the plots that are generated by TGraph: there is a solid line at the origin. Is it my imagination or is this new?
I would like to disable it as it can be annoying when the values plotted approach y=0. I’ve tried going through the editor and looking through the paint methods for flags that might change the axis drawing, but haven’t had any luck yet.
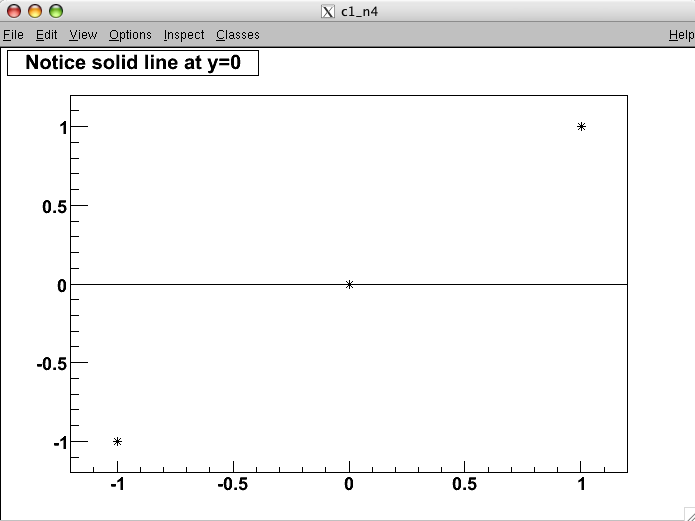
Here’s a quick script and the ouput so you can see what I’m talking about.
{

TCanvas c1;
TGraph g;

// Fill graph with some test points
g.SetPoint(0, -1,-1);
g.SetPoint(1,  0, 0);
g.SetPoint(2,  1, 1);

g.SetTitle("Notice solid line at y=0");
g.Draw("A*");

}
I re-checked my old v4.04 plots and my sanity is still intact: this is new behaviour. Perhaps the draw option “A” could function as it used to (“Draw axis around the graph” as TGraph::PaintGraph() says) and a new option, say “O” could be for “Draw Origin”.
I suppose what users expect to happen is a matter of circumstance and personal preference. Personally, I would benefit from returning draw option “A” to its previous behaviour and creating a separate flag for drawing of the origin.
I am surprised that it worked differently before. Seems to me this line has always been there. But I’ll check in the CVS history what could have triggered this change.