I am new to ROOT and I need to highlight the portion of the 2D histogram after applying the cut condition.
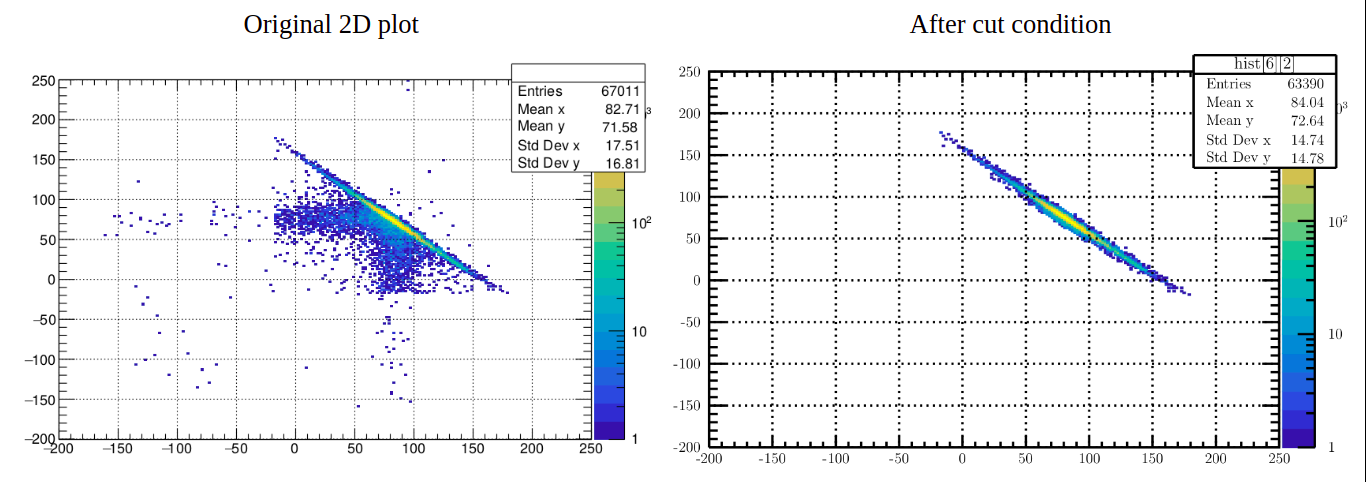
I am creating two different plots: 1) before (left), and 2) after (right) applying the cut condition (see image). I want to plot these two plots on the same canvas and want to highlight the cut region.
Any suggestion on how can I do that. I think it would be better if I use a different colormap for the cut region, but I am not sure how to do that.
https://root.cern/doc/v610/classTHistPainter.html#HP14
Search for the example with the text “Example of col plots with option SAME”. You can fill a second histogram (e.g. hcut2) with the entries that get cut out (using the opposite condition as for hcut), then scale this second histogram (or use SetBinContent to give all of its bins one same value, i.e. one same colour when plotted) so that its values (colours) are different from hcut, either lower than the ninimum or higher than the maximum, and plot it (hcut2) with SAME after plotting hcut; you may have to adjust the minimum or maximum of hcut so the colours are clearly different. E.g. if the maximum of hcut is 2.5x10^3, you could fill hcut2 with 4x10^3 (play with the values!) and then do hcut->SetMaximum(4*10e3)…