Gaussian fitting of multiple peaks using TSpectrum

Need Help ! Can someone provide the demo example of gaussian fitting of multiple peaks using TSpectrum class generated from .tex file


Please read tips for efficient and successful posting and posting code

ROOT Version: 6.14
Platform: Ubuntu
Compiler: Not Provided


See the TSpectrum tutorials.

I uesd the TSpectrum class but i’m not getting the desird result.
This is the code which i’m using :

#include "TFile.h"
#include "TH1.h"
#include "TF1.h"
#include "TMath.h"
#include "TVirtualFitter.h"
#include "TSpectrum.h"


Int_t npeaks = 18;
Double_t fpeaks(Double_t *x, Double_t *par) {
//   Double_t result = fpol->EvalPar(x,par);
Double_t result = par[0] + par[1]*x[0];
   for (Int_t p=0;p<npeaks;p++) {
     Double_t norm  = par[3*p+2]; // "height" or "area"
      Double_t mean  = par[3*p+3];
      Double_t sigma = par[3*p+4];
     // result += norm*TMath::Gaus(x[0],mean,sigma);
#if defined(__PEAKS_C_FIT_AREAS__)
      norm /= sigma * (TMath::Sqrt(TMath::TwoPi())); // "area"
#endif /* defined(__PEAKS_C_FIT_AREAS__) */
      result += norm*TMath::Gaus(x[0],mean,sigma);

   }
   return result;
}
void fitg_c1(Int_t np=10) {

  TTree *t = new TTree("t", "no. of events");
  t->ReadFile("a.txt", "v/D"); 

  TH1 *h = new TH1D("h", "Histogram(no. of events/cone diameter);cone-diameter;no. of events", 100, 140, 330);
  t->Project("h", "v");

//generate n peaks at random
   Double_t par[1000];
   par[0] = 0.6;
   par[1] = -0.6/1000;
   Int_t p;
   for (p=0;p<npeaks;p++) {
  

 par[3*p+2] = 1; // "height"
      par[3*p+3] = 10+gRandom->Rndm(); // "mean"
      par[3*p+4] = 2*gRandom->Rndm(); // "sigma"

#if defined(__PEAKS_C_FIT_AREAS__)
      par[3*p+2] *= par[3*p+4] * (TMath::Sqrt(TMath::TwoPi())); // "area"
#endif /* defined(__PEAKS_C_FIT_AREAS__) */
   }
   TF1 *f = new TF1("f",fpeaks,140,330,2+3*npeaks);
   f->SetNpx(1000);
   f->SetParameters(par);
   TCanvas *c1 = new TCanvas("c1","c1",10,10,1000,900);
   c1->Divide(1,2);
   c1->cd(1);
   h->FillRandom("f",200000);
   h->Draw();
   TH1F *h2 = (TH1F*)h->Clone("h2");
   //Use TSpectrum to find the peak candidates
   TSpectrum *s = new TSpectrum(2*npeaks);
   Int_t nfound = s->Search(h,2,"",0.02);
   printf("Found %d candidate peaks to fit\n",nfound);
   //Estimate background using TSpectrum::Background
   TH1 *hb = s->Background(h,20,"same");
   if (hb) c1->Update();
if (np <0) return;


   c1->cd(2);
   TF1 *fline = new TF1("fline","pol1",140,330);
   h->Fit("fline","qn");
   //Loop on all found peaks. Eliminate peaks at the background level
   par[0] = fline->GetParameter(0);
   par[1] = fline->GetParameter(1);
   npeaks = 0;
#if ROOT_VERSION_CODE >= ROOT_VERSION(6,00,00)
   Double_t *xpeaks; // ROOT 6
#else
   Float_t *xpeaks; // ROOT 5
#endif
   xpeaks = s->GetPositionX();
   for (p=0;p<nfound;p++) {
      Double_t xp = xpeaks[p];
      Int_t bin = h->GetXaxis()->FindBin(xp);
      Double_t yp = h->GetBinContent(bin);
      if (yp-TMath::Sqrt(yp) < fline->Eval(xp)) continue;
      par[3*npeaks+2] = yp; // "height"
      par[3*npeaks+3] = xp; // "mean"
      par[3*npeaks+4] = 3; // "sigma"
#if defined(__PEAKS_C_FIT_AREAS__)
      par[3*npeaks+2] *= par[3*npeaks+4] * (TMath::Sqrt(TMath::TwoPi())); // "area"
#endif /* defined(__PEAKS_C_FIT_AREAS__) */
      npeaks++;
   }
   printf("Found %d useful peaks to fit\n",npeaks);
   printf("Now fitting: Be patient\n");
   TF1 *fit = new TF1("fit",fpeaks,0,1000,2+3*npeaks);
   //we may have more than the default 25 parameters
   TVirtualFitter::Fitter(h2,10+3*npeaks);
   fit->SetParameters(par);
   fit->SetNpx(1000);
   h2->Fit("fit");
}

#if !defined(__CINT__) && defined(__PEAKS_C_FIT_AREAS__)
#undef __PEAKS_C_FIT_AREAS__
#endif /* !defined(__CINT__) && defined(__PEAKS_C_FIT_AREAS__) */

this generate the result:

The histogram created is this is different than the normal/ original, created with t: { TTree *t = new TTree("t", "no. of events"); t->ReadFile("a.txt", "x/D"); // one velocity per line TH1D *h = new TH1D("h", "Histogram(no. of events/cone diameter);cone-diameter;no. of events", 100, 140, 350); t->Project("h", "x"); // delete t; // no longer needed // h->Draw("L"); h->Draw("HISTO"); }

I want to get my histogram with multiple peak fitting like this :

File:
a.txt (33.0 KB)

May be this example is what you are looking for ?

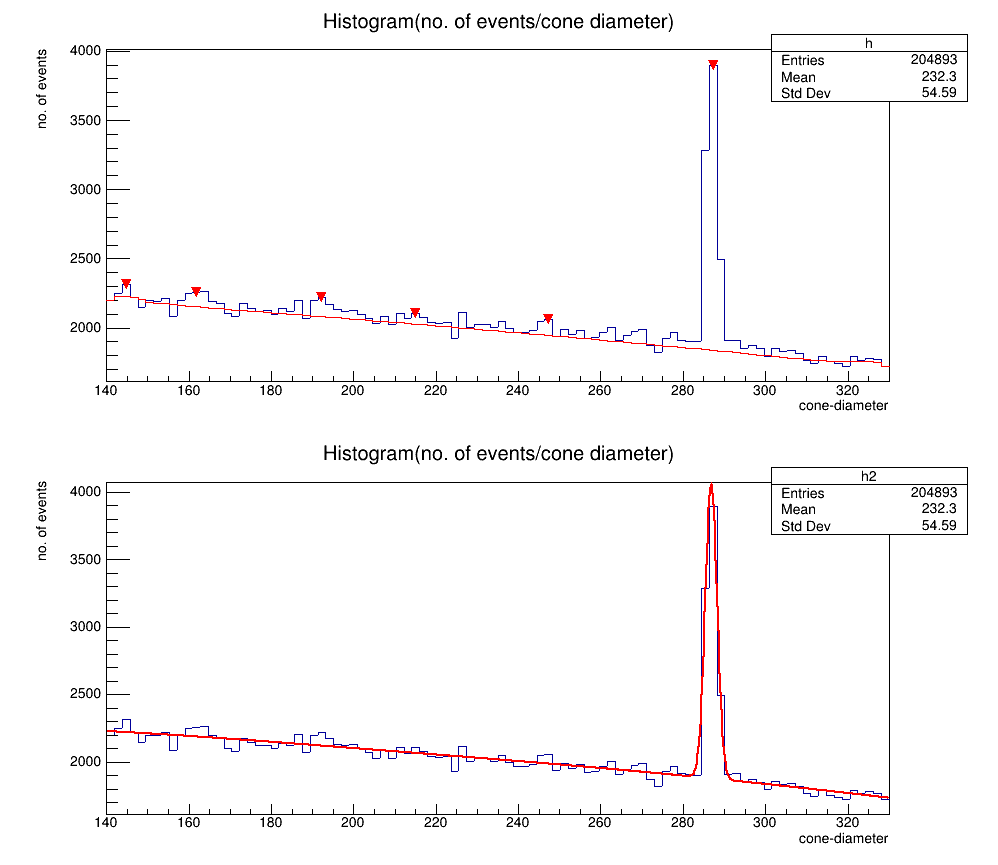
No, this example is for smoothing(which can be performed using draw panel) but i want to fit the Gaussian peak.
Here is the old example (which is not working in my system with root6 in ubuntu) for older root vs. in window system, can you tell me how this can be modified in my case :

// NPEAKS gaussian peaks + background (Gaus,Linear or Parabolic): 1-dimensional fit 
// author: Gabriele Sirri

#include <iostream>
#include <fstream>

#define NPEAKS  9// <-- Number of peaks
#define MLIM     50	// Mean value limit of the signal fit ( m-MLIM <  m  < m+MLIM ) ADDITIONAL
#define SLIM     1.5	// Sigma      limit of the signal fit ( s/SLIM <  s  < s*SLIM ) PROPORTIONAL
#define CLIM      5	// Constant   limit of the signal fit ( c/CLIM <  c  < c*CLIM ) PROPORTIONAL

//#define NBCKPARS  3			// GAUSSIAN OR PARABOLIC BACKGROUND
//#define NBCKPARS  2		// LINEAR OR LANDAU BACKGROUND 
#define NBCKPARS  0		// NO BACKGROUND

#define NPARS    NPEAKS*3 +  NBCKPARS
Double_t Pars[NPARS] ;
Double_t fitPars[NPARS] ;


//_____________________________________________________________________________
// The signal function: a gaussian
Double_t Signal(Double_t *x, Double_t *par)
{
	Double_t arg = 0;
	if (par[1]) arg = (x[0] - par[0])/par[1];
	Double_t sig = par[2]*TMath::Exp(-0.5*arg*arg);
	return sig;
	//	return TMath::Gaus(x[0],par[0],par[1],par[2]);		// doesn't work...
}

//  background function
Double_t Background(Double_t *x, Double_t *par) 
	{ 
		//return TMath::Landau(x[0],par[0],par[1]);			//Landau background  // doesn't work...
		//return par[0] + par[1]*x[0] ;						//Linear background
		//return par[0] + par[1]*x[0] + par[2]*x[0]*x[0];	//Quadratic background	
		//return Signal(x,par) ;							//Gaussian background
		return 0 ;								// No Background	
}

// Sum of NPEAKS peaks function + background 
Double_t fitFunctionNB(Double_t *x, Double_t *par)
{
	Double_t tot = 0 ;
	Int_t a=0 ;			// a= address of parameters array
	for(a;a<NPEAKS;a++)
	{
		 tot +=  Signal(x,&par[a*3]) ;
	}
	tot += Background(x,&par[a*3]) ;
   return tot;
}
//_____________________________________________________________________________
// FIRST GUESS

void ReadPars(char* filename="a.txt")
{
	ifstream f(filename);
	Int_t i=0;
	while(f>>Pars[i++] ) if(i==NPARS) break; 
	f.close();
}
void WritePars(char* filename="pars.txt")
{
	ofstream f(filename);
	for(Int_t i=0;i<NPARS;i++)
	{
		f<<fitPars[i];
		if((i+1)%3) f<<"      "; else f<<endl;
	}
	f.close();
}
//_____________________________________________________________________________
// Utilities
Double_t FindLowerLimit(TH1* h)
{
	for(int k=0;k<h->GetNbinsX();k++)
		if ( h->GetBinContent(k) ) 
			return h->GetBinCenter(k);
}
Double_t FindUpperLimit(TH1* h)
{
	for(int k=h->GetNbinsX()-1;k>-1;k--)
		if ( h->GetBinContent(k) ) 
			return h->GetBinCenter(k);
}
//_____________________________________________________________________________
TH1D* GetHistFromFile4(char* filename, Int_t nbinsx,Double_t xmin, Double_t xmax)
{
	Double_t a,b;
	Double_t pi=acos(-1);
	Int_t c,d ;
	TH1D* h1 = new TH1D("htemp","htemp",nbinsx,xmin,xmax);
	ifstream f(filename);
	while(f>>a>>b>>c>>d) {h1->Fill(a*b*pi); }
	f.close();
	h1->Draw();
	return h1 ;
}
//_____________________________________________________________________________
TH1D* GetHistFromFile2(char* filename, Int_t nbinsx,Double_t xmin, Double_t xmax)
{
	Double_t a,b,pi(acos(-1));
	TH1D* h1 = new TH1D("htemp","htemp",nbinsx,xmin,xmax);
	ifstream f(filename);
	while(f>>a>>b) h1->Fill(a*b*pi); 
	f.close();
	h1->Draw();
	return h1 ;
}
//_____________________________________________________________________________


// *************************************************************************
//  Fit NPEAKS gaussian peaks +  background
void backsigNB(char* fitoption="V")
{
	int npar = NPARS;
	int bckpar = NBCKPARS;
	int peakpar = 3;

	Double_t x1 = FindLowerLimit(htemp);
	Double_t x2 = FindUpperLimit(htemp);
	printf("x1: %f\t x2: %f\n",x1,x2);

	Double_t* guess_par = &Pars ;

	// create a TF1 with the range from -1.1 to 1.1 and 24 parameters
	TF1 *fitFcn = new TF1("fitFcn",fitFunctionNB,x1,x2,npar);
	fitFcn->SetParameters(guess_par); 
	fitFcn->SetNpx(300);
	// Set Limits for the signal parameters 
	for(int j=0;j<NPEAKS;j++) 
	{
		int ipar = 3*j;
		fitFcn->SetParName(ipar  ,"Mean_value");
		fitFcn->SetParName(ipar+1,"Sigma");
		fitFcn->SetParName(ipar+2,"Constant");
		//fitFcn->SetParLimits(ipar,50,1000);
		Double_t mval = fitFcn->GetParameter(ipar);		
		fitFcn->SetParLimits(ipar  ,mval-MLIM,mval+MLIM);// define parameters LIMITS for mean value

		Double_t sval = fitFcn->GetParameter(ipar+1);
		fitFcn->SetParLimits(ipar+1,sval/SLIM ,sval*SLIM);// define parameters LIMITS for sigma

//		Double_t cval = fitFcn->GetParameter(ipar+2);
//		fitFcn->SetParLimits(ipar+2,cval/CLIM ,cval*CLIM);// define parameters LIMITS for constant	
	}

	htemp->Fit("fitFcn",fitoption);
	Double_t BinWidth =  htemp->GetBinWidth(0);

	Double_t* fit_par = new Double_t[npar];
	// writes the fit results into the par array
	fitFcn->GetParameters(fit_par);

	// PRINT RESULTS

	// Peak Area Evaluation
	Double_t signalarea;
	for( j=0;j<NPEAKS;j++) 
	{
		int ipar =3*j;
		char funcname[16];
		sprintf (funcname,"peakFcn%d",j);
		TF1 *peakFcn = new TF1(funcname,Signal,x1,x2,peakpar);
		peakFcn->SetParameters(&fit_par[ipar]);
		Double_t peakarea =  peakFcn->Integral(x1,x2) /BinWidth;

		printf("Peak %2d Mean: %7.1f\tSigma: %5.1f\tConst: %7.1f  Area:%11.3f\n", j,
				fit_par[ipar] , fit_par[ipar+1] , fit_par[ipar+2] , peakarea );
		signalarea += peakarea;
		// improve the picture:
		//peakFcn->SetLineColor(j%2?5:4);	// comment this two lines to not plot single peaks 
		//peakFcn->Draw("same");		// comment this two lines to not plot single peaks
	}
	printf("\t\t\t\t\t\t\t\t----------\n");
	printf("\t\t\t\t\t\t   Total Peaks:%11.3f\n\n", signalarea);

	// Background Evaluation
	Double_t bckarea;
	{
		TF1 *bckFcn = new TF1("bckFcn",Background,x1,x2,bckpar);
		bckFcn->SetParameters(&fit_par[NPEAKS*3]);
		bckarea =  bckFcn->Integral(x1,x2) /BinWidth;
			printf("Background ");
			for(Int_t i=0;i<NBCKPARS;i++)
				printf("p%d:%f ",i,fit_par[NPEAKS*3+i] );
			printf("\t  Area:%11.3f\n", bckarea);
		// improve the picture:
		//bckFcn->SetLineColor(3);	// comment this two lines to not plot background
		//bckFcn->Draw("same");		// comment this two lines to not plot background
	}
	Double_t fitarea = fitFcn->Integral(x1,x2) /BinWidth;

	printf("\t\t\t\t\t\t\t\t----------\n");
	printf("\t\t\t\t\t\t    Total Area:%11.3f\n\n", fitarea);
	printf("\t\t\t\t\t\t Total Entries:%11.3f\n", htemp->Integral(x1,x2) );
	printf("\t BIN WIDTH: %f\n",BinWidth) ;

	fitFcn->Draw("same");

	//EXPORT pars
	for(Int_t i=0;i<NPARS;i++) fitPars[i]= fit_par[i];
}
//
 // *************************************************************************

void Do()
{
	h = GetHistFromFile4("a.txt",150,0,4500);
	ReadPars();
	backsigNB();
	WritePars();
}

The first error I get (after some warnings) is:

/Users/couet/roottest/Do.C:123:33: error: use of undeclared identifier 'htemp'
   Double_t x1 = FindLowerLimit(htemp);
                                ^

If you look at your code at line 123 you will see, it is true: htemp is not declared

I have no idea how to modify it for this error (as much i know htemp is related to properties of graph)…do you know needed modification !!?

I have no idea either. That’s your code. You have:

void backsigNB(char* fitoption="V")
{
   int npar = NPARS;
   int bckpar = NBCKPARS;
   int peakpar = 3;

   Double_t x1 = FindLowerLimit(htemp);
   Double_t x2 = FindUpperLimit(htemp);
[...]

so htemp comes from nowhere … what should it be ?

Thanks. I’m trying. Above mentioned program maybe work if i could modify my histo.
Do you know how my histo generated from a.txt file can be obained in the sample histo form.
FILE:
a.txt (33.0 KB)

(In sample histo form peaks are well defined and separated with some space.)
My histo:

Sample histo:
smple%20histo

I am not sure what you mean exactly. My guess is you want to create a 1D histogram from the data contained in the file a.txt ? Something like:

{
   auto h1= new TH1F("h1", "h1", nbins, xmin, xmax);
   ifstream inp; double x;
   inp.open("a.txt");
   for (int i=1; i<=nbins; i++) {
      inp >> x;
      h1->SetBinContent(i,x);
   }
  h1->Draw();
}

Note: you should define nbins, xmin and xmax

Thank you. I tried and got this.

I want to make a histogram like the sample histogram (each set of the bar is distinguished from the neighbor bar set and shows clear maximum and minimum set of bars).

do (instead of auto)

   TH1F* h1= new TH1F("h1", "h1", nbins, xmin, xmax);
{
   int nbins = 3799;
   TH1F *h1= new TH1F("h1", "h1", nbins, 0., nbins);
   ifstream inp; double x;
   inp.open("a.txt");
   for (int i=1; i<=nbins; i++) {
      inp >> x;
      h1->SetBinContent(i,x);
   }
  h1->Draw();
}

Thanks @couet.
But i do not want entry/bin. I want to get that histo automatically with well defined peaks as in sample histo(i got some when i draw it and zooming y axis but not so good as compared to sample) .

So I do not know what the values stored in a.txt mean… Up to you to use them as you need … The macro I sent you shows how to read the file.