Hi All,
How can I write code to plot multiplicity as function of centrality? (0-5%, 5-10%, etc)? I need hint with the iteration over centrality bin only.
Thanks,
Hi All,
How can I write code to plot multiplicity as function of centrality? (0-5%, 5-10%, etc)? I need hint with the iteration over centrality bin only.
Thanks,
Hi,
Can you be more specific? Show some code - e.g. what’s the layout of your input data that you want to plot? Is that coming from a TTree?
Cheers, Axel.
Does anyone have any ideas or solution for this? Kinda stuck with a similar problem.
Could you be more specific ?
I need to write a code to plot eccentricity as a function of centrality. Like I have n multiplicities for 10000 collisions. n varies with each collision. So I have different impact parameter values for each collision. Does anyone have any idea about Reference Multiplicity?
Okay so I have a TH1F histogram with 10k entries. So the sum of all the entries = 10k right?
so when the sum of entries = 100 ; then the centrality will be 0-10%
lets say the entries start from nth bin and when sum of entries is 100 it is the mth bin.
I need to find the lowest valued entry of nth bin and highest valued entry of mth bin
then when the sum of entries = 200; the centrality will be 10-20%
and so on…
Any help or suggestions would be great. Thanks!
Also any references or docs for working with bins?
Have a look here ate all the GetBin* and SetBin* methods.
How can I find the min value of entry and maximum value of entry of a particular bin?
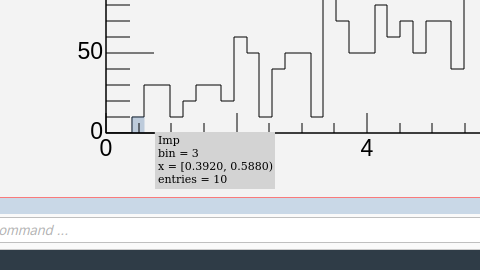
Like here it says x =[0.3920, 0.5880)
how can I get these values for each bin? And how can I get bin center?
See all the getters in the page I sent you: GetBinLowEdge, GetBinCenter etc …
So how can I sum the number of entries in each bin and when the sum reaches a certain value I need to find the bin center of that particular bin?
That’s the definition of the “bin content” if you fill the bins with a weight equal to1 (which I think is your case).
Yes, lets say I have 100 bins. And there are 0 entries in bin 0, 1 and 2.
5 entries in 3rd bin.
8 in 4th bin.
9 in 5th bin and so on.
So now I want the "n"th bin where the sum of entries i.e 5 + 8 + 9 + …= 1000
I need the "n"th bin center.
bin numbering start at 1, not at 0.
h->GetBinContent(n);
?
nth bin is the bin where sum of entries = 1000
I am not sure about it. I will clarify it soon.
int n = ...;
printf("%g\n",h->GetBinContent(n));
int n = ...;
printf("%g\n",h->GetBinCenter(n));
Actually I need something like this. Has anyone worked on these kinda topic?
Collision centrality.
Please send some code, doing what you want to do. Even if it is not fully working it will help to better understand what your question is about. Are you talking about booking and filling a new histogram ? accessing the value of an existing one ? or … ?
A1.C (5.6 KB)
https://drive.google.com/file/d/1KEwynNDrXrOGenniBhYhZFwGuFHTtAAu/view?usp=sharing
Okay. So in this macro I have one TProfile histogram, i.e. Eccentricity vs Impact parameter. I want to create another histogram in which instead of Impact paramater on the X-axis, I want centrality %. The image that shared earlier.
The hprof1 you have now is:
TProfile *hprof1 = new TProfile("hprof1", "Eccentricity vs b for n = 2 for S = 0", 40, 0, 20);
It looks like you want new one hprof2 from 0 to 80 ? what will be the number of bins, sill 40 ?
Then you need to fill it with a new value (centrally % ?) which you need to define …
How can I join the points of hprof2 and make it a line?
A1.C (8.4 KB)
Can anyone help me join the points of a TProfile histogram in a line?