Hi all,
I am using PyROOT to plot mutiple (similar) histograms using TCanvas:: Divide():
I used TF1 for testing (see the following code).
import ROOT as r
N = 2
canvas = r.TCanvas("canvas object name","function",600,400)
canvas.Divide(N,N)
for i in range(N*N):
canvas.cd(i+1)
cosx = r.TF1('cosx{}'.format(i),'cos(x+[0])',0,6.284)
# cosx = r.gDirectory.GetObject('cosx{}'.format(i))
cosx.SetParameter(0,i)
cosx.Draw()
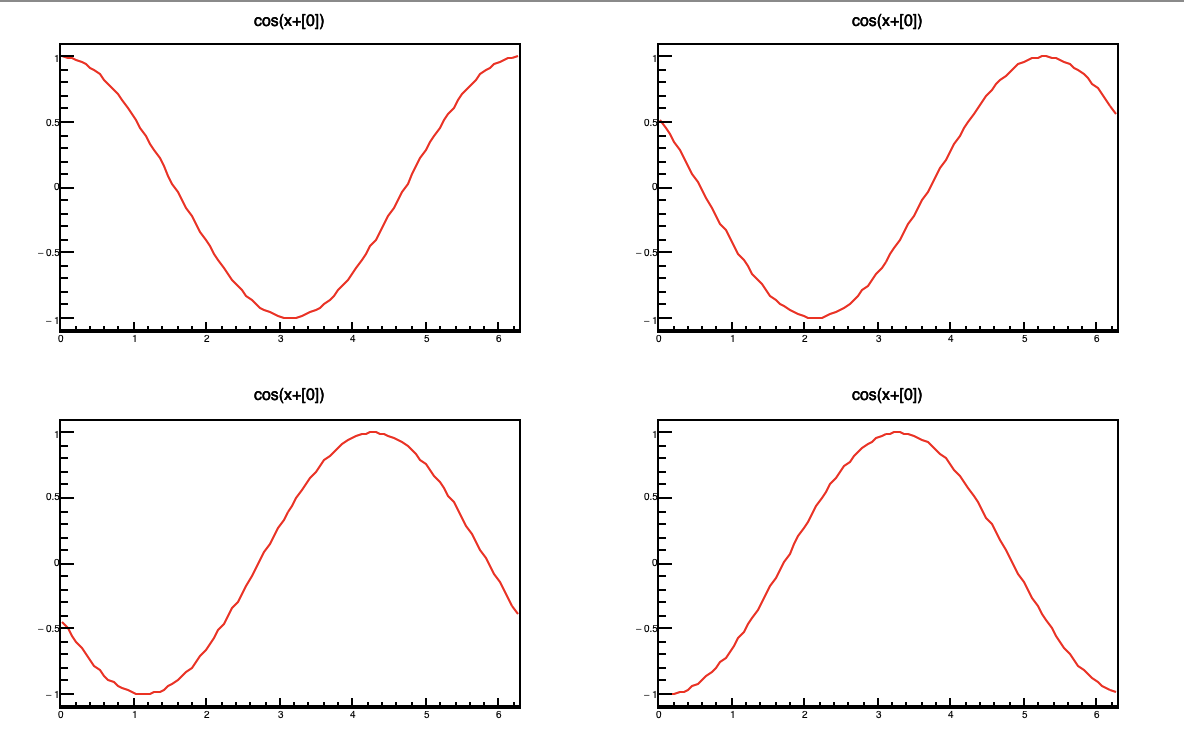
canvas.Draw()
the output look like this:
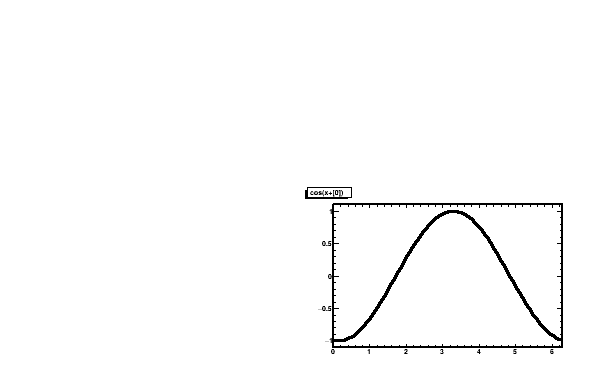
I also tried the following (with no luck):
put r.TF1(....) outside the for loop, ending up with 4 identical plots.
uncomment the gDirectory.Get line, I got an error which says:
Template method resolution failed: Failed to instantiate “GetObject(std::string)”
I am sure that other users also have encounterred the problem (but I really cant find a precise way to describe the problem, so I decide to ask in the Newbie section). Could somebody suggest the best way to do this kind of plot for me ? Thanks in advance.
_ROOT Version: 6.24 (PyROOT via conda)
_Platform:Centos7
_Compiler: gcc9
void junkai() {
   int N = 2;
   auto canvas = new TCanvas("canvas object name","function",600,400);
   canvas->Divide(N,N);

   for (int i=0; i<N*N; i++) {
      canvas->cd(i+1);
      auto cosx = new TF1(Form("cosx{%d}",i),"cos(x+[0])",0,6.284);
      cosx->SetParameter(0,i);
      cosx->Draw();
   }
}
thanks for the suggestion. It worked in macro but not in python. Is there other method than the DrawCopy() in PyROOT (just curious) ?
Btw, I also found that the object that is created in the for loop cant be accessed by running: gDirectory->ls();. Outside the loop, I have a TH3 object and (of course) the canvas. But only the TH3 was listed when gDirectory->ls(); was run. Am I using the correct way to access the list of created Objects?
void PhaseMapTest(){

	int NBinX = 18;
	int NBinY = 9;
	int NBinZ = 1000;

	TH3F* phase_map = new TH3F("phase_map","phase map title;posiInitposX [mm]; posiInitPosY [mm]; posiInitTime [#mu s]",NBinX,-45,45,NBinY,-45,45,NBinZ,0,149.2);
	phase_map->Sumw2();

	int x = 8;
	int y = 7;
	phase_map->GetXaxis()->SetRange(x+1,x+1);

	int N = 2;
   auto canvas = new TCanvas("canvas object name","function",600,400);
   canvas->Divide(N,N);

   for (int i=0; i<N*N; i++) {
      canvas->cd(i+1);
      auto cosx = new TF1(Form("cosx{%d}",i),"cos(x+[0])",0,6.284);
      cosx->SetParameter(0,i);
      cosx->Draw();
   };
	canvas->Print("t.png");
	gDirectory->ls();