Hello, in this root file WeTransfer - Send Large Files & Share Photos Online - Up to 2GB Free I stored in the TTree B1Scintparticles simulated data of particles hitting a scintillator. The branche ScintParticleKinEn is the kinetic energy of particles and the branch ScintParticleID is the Pdg code of the particle (for example ScintParticleID ==11 is an electron, ScintParticleID==-11 is a positron and ScintParticleID ==22 is a photon).
By this macro
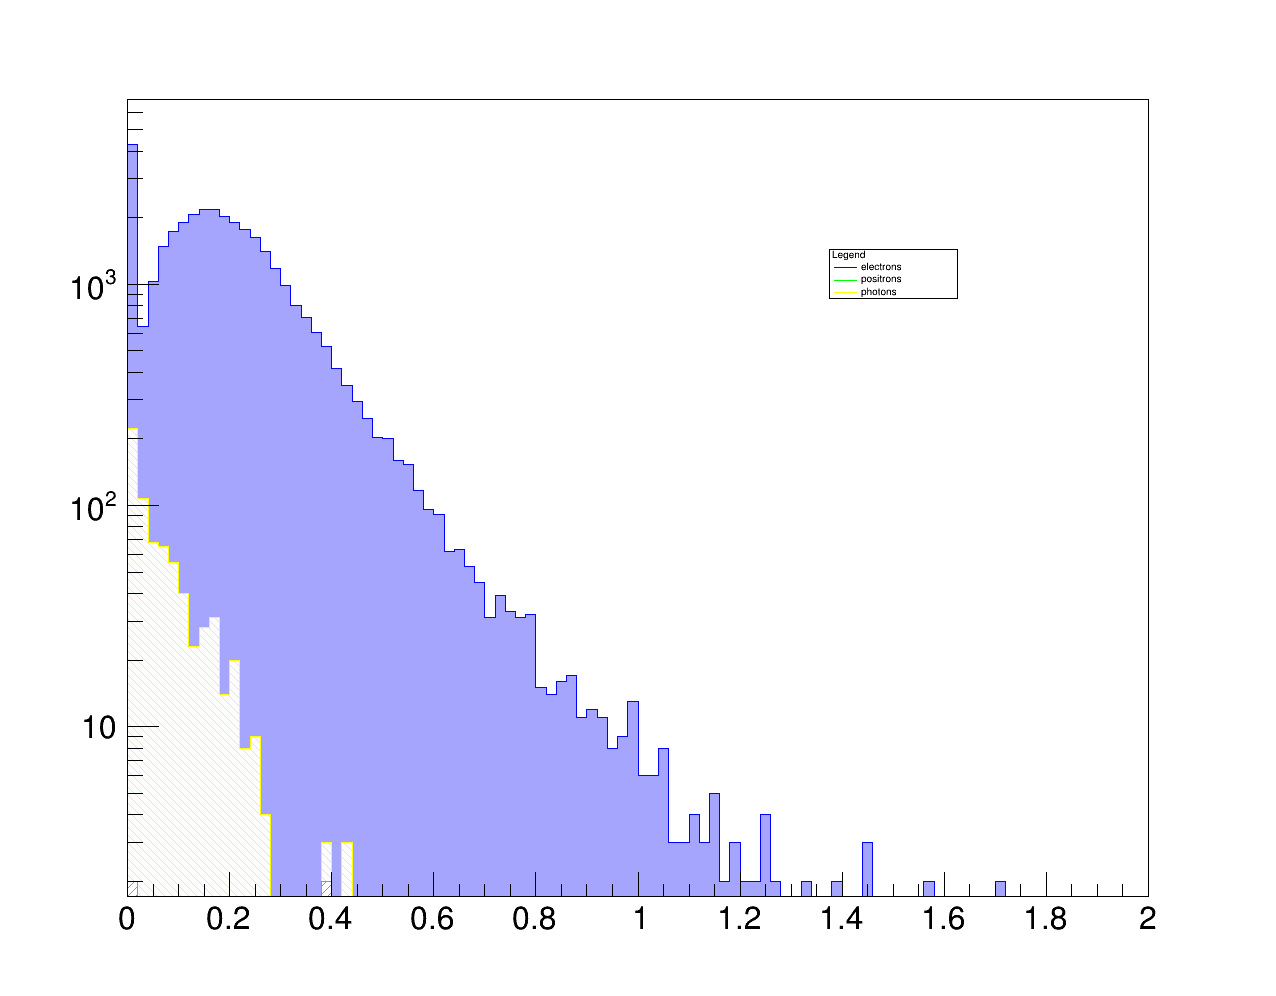
I can plot the kinetic energy of a specif particle, for example: scintillator.cpp (3.2 KB)
If you are filling the histograms with tree->Draw, you can save each Draw to a different histogram, e.g. 3 lines like this (of course, using h1, h2, h3 and cut1, cut2, cut3, resp.):
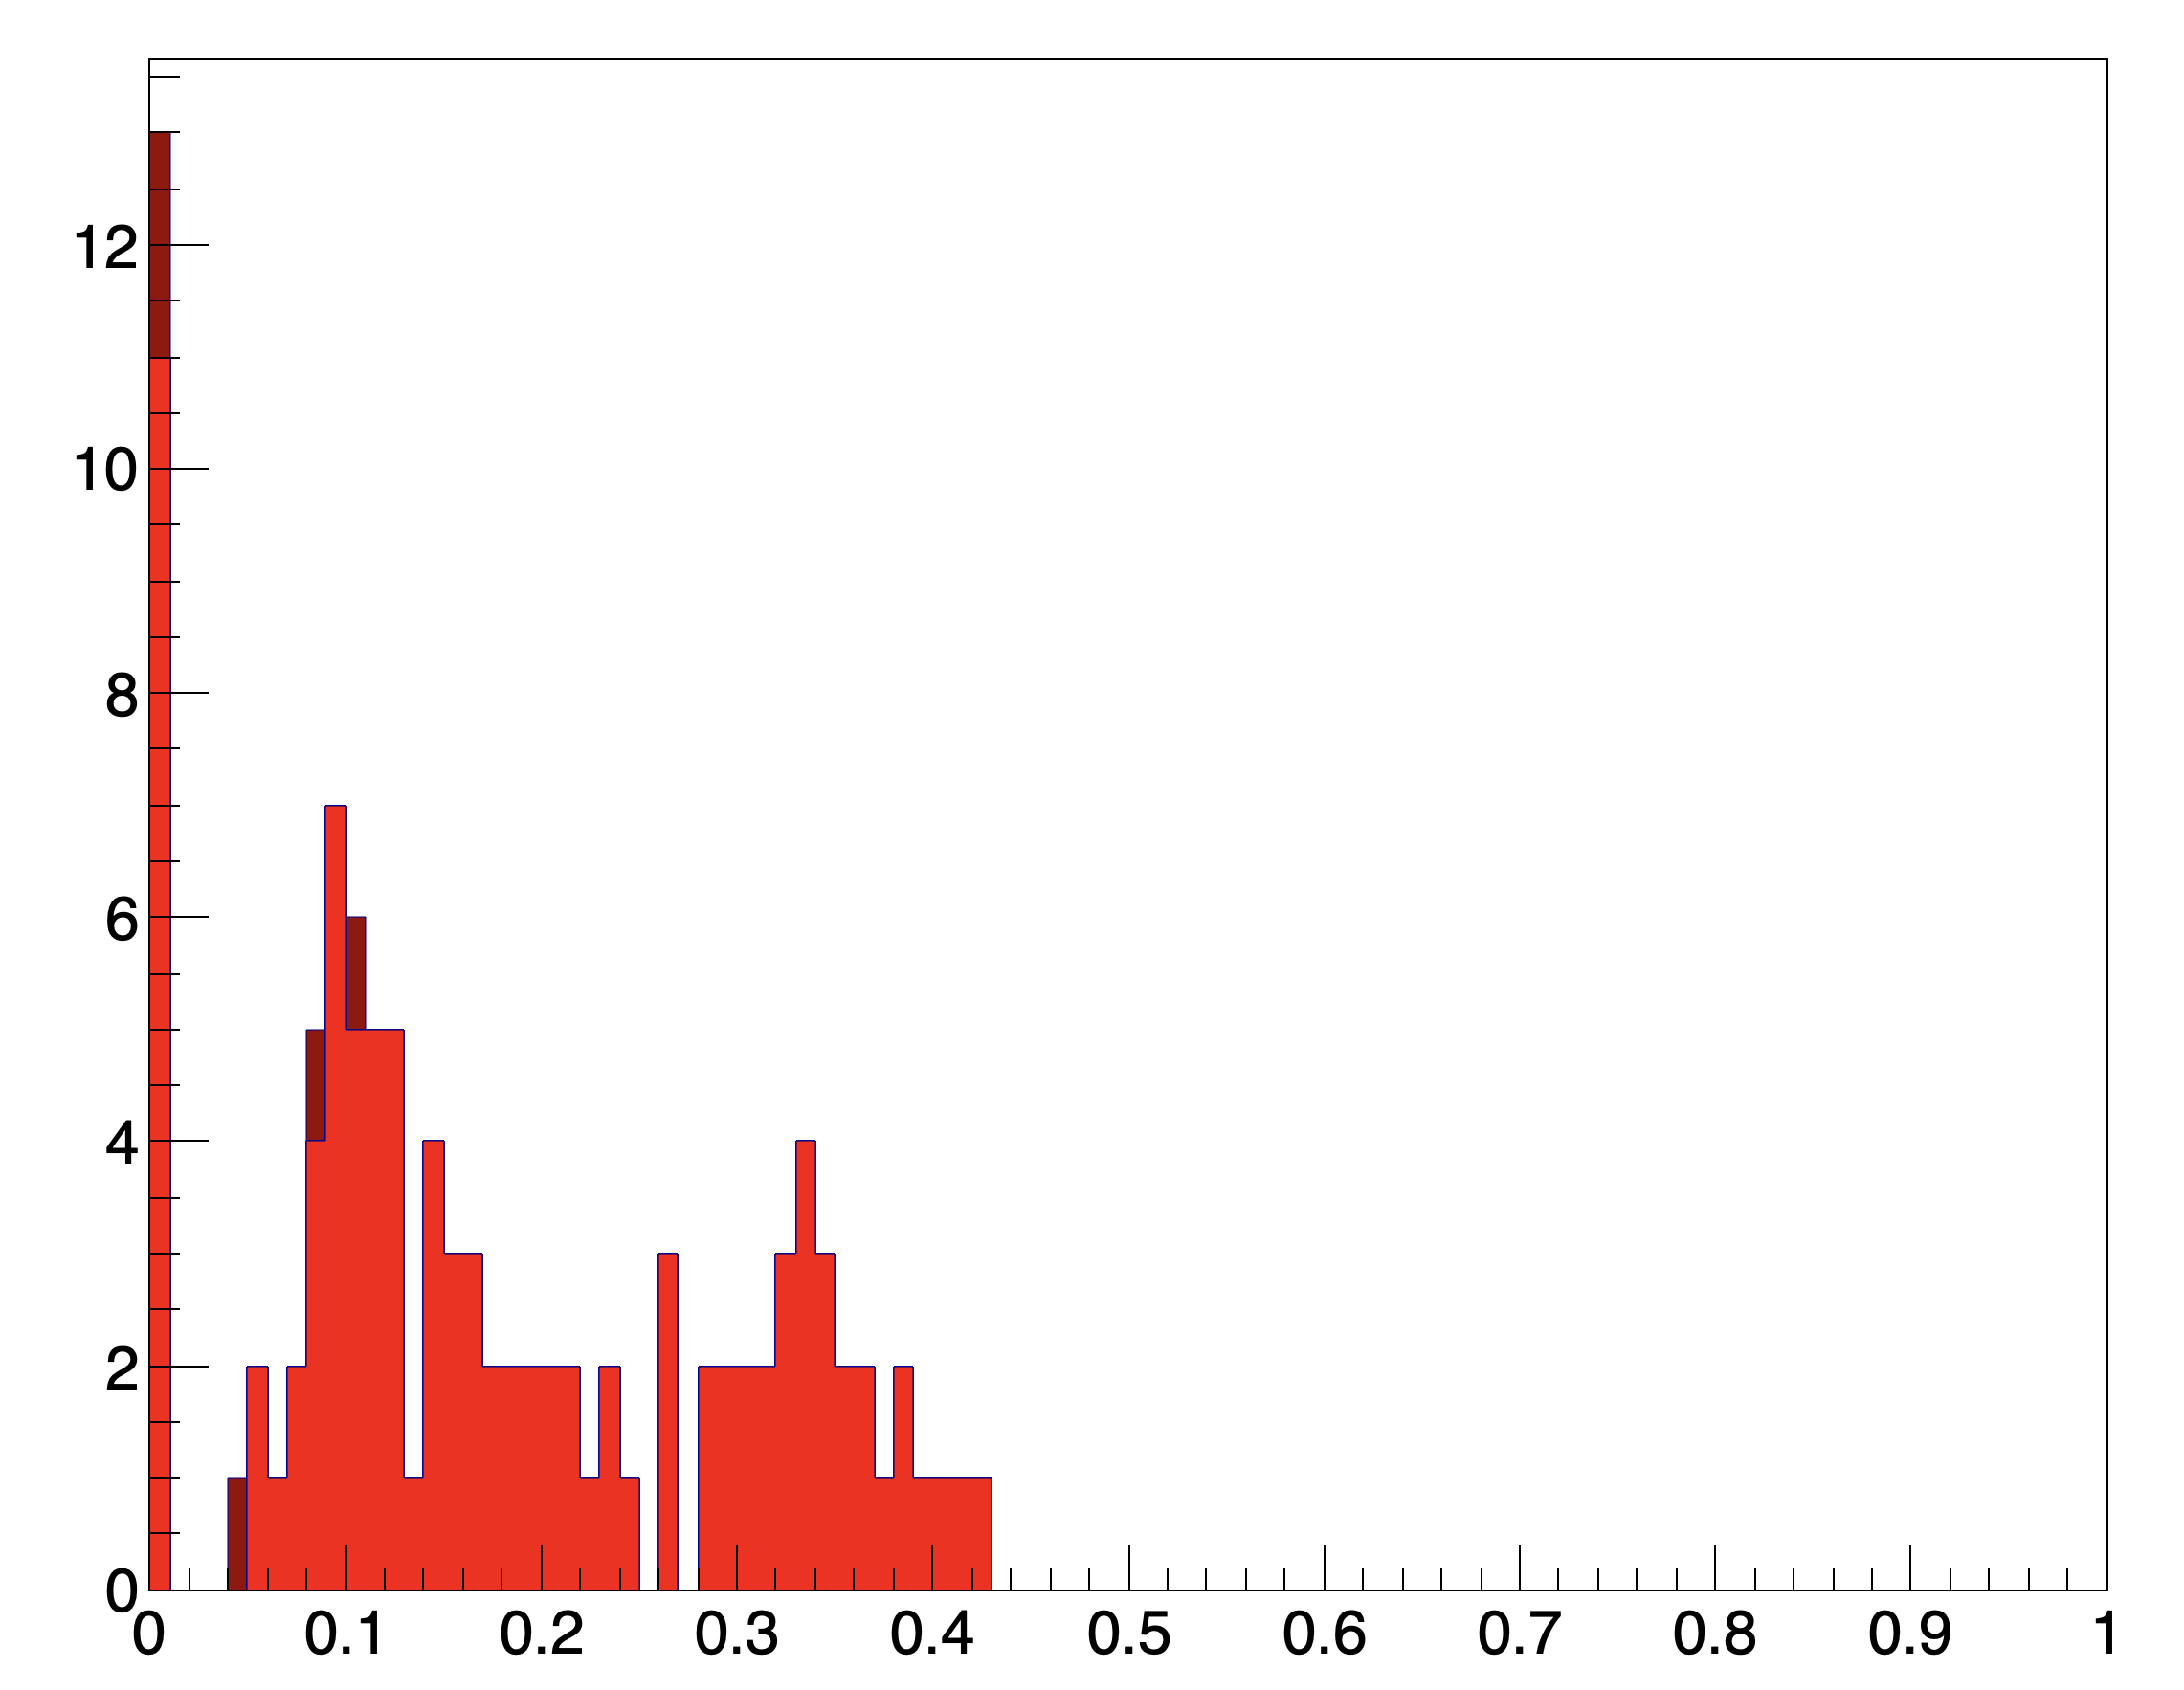
Hello @couet thank you, your code works and I get this graph (it looks like different from your graph because here on root forum I just uploaded a semple of few simulated events…)
in this case the macro doesn’t crash, but I don’t get the axes titles…
I need to know how many electrons, positrons and photons hit the scintillator then I wanted to print the TPavestats to read the entries, but even if I don’t have SetStats(0) in the macro, if write the code
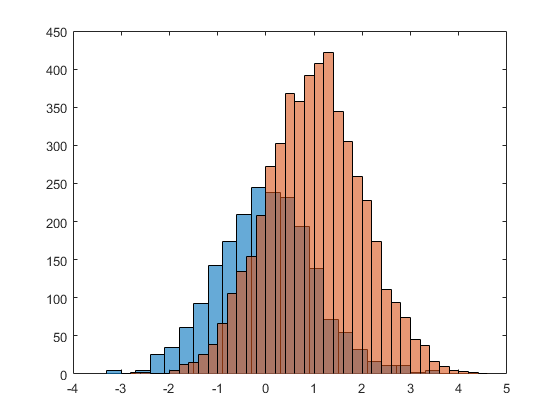
{
  TH1F *h1 = new TH1F("h1", "h1 for a test hstack", 10, -4, 4);
  h1->FillRandom("gaus", 20000); h1->SetFillColor(kRed);
  TH1F *h2 = new TH1F("h2", "h2 for a test hstack", 10, -4, 4);
  h2->FillRandom("gaus", 15000); h2->SetFillColor(kBlue);
  TH1F *h3 = new TH1F("h3", "h3 for a test hstack", 10, -4, 4);
  h3->FillRandom("gaus", 10000); h3->SetFillColor(kGreen);
  TCanvas *c = new TCanvas("c", "c");
  // first, draw all histograms so that their "stats" boxes are created
  TPaveStats *s = 0;
  h1->Draw(""); gPad->Modified(); gPad->Update();
  s = (TPaveStats*)h1->FindObject("stats");
  if (s) { s->SetY1NDC(s->GetY1NDC() - 0.1); s->SetY2NDC(s->GetY2NDC() - 0.1); }
  h2->Draw(""); gPad->Modified(); gPad->Update();
  s = (TPaveStats*)h2->FindObject("stats");
  if (s) { s->SetY1NDC(s->GetY1NDC() - 0.3); s->SetY2NDC(s->GetY2NDC() - 0.3); }
  h3->Draw(""); gPad->Modified(); gPad->Update();
  s = (TPaveStats*)h3->FindObject("stats");
  if (s) { s->SetY1NDC(s->GetY1NDC() - 0.5); s->SetY2NDC(s->GetY2NDC() - 0.5); }
  // then, create and draw the hstack
  THStack *hs = new THStack("hs", ""); // note: an empty title
  hs->Add(h1); hs->Add(h2); hs->Add(h3);
  hs->Draw("nostack"); // ("") or ("nostack")
  gPad->Modified(); gPad->Update(); // make sure it's really (re)drawn
  hs->SetTitle("My test hstack");
  hs->GetXaxis()->SetTitle("My X axis");
  hs->GetYaxis()->SetTitle("My Y axis");
  gPad->Modified(); gPad->Update(); // make sure it's really (re)drawn
}